• Data visualisation

Data visualisation

Date
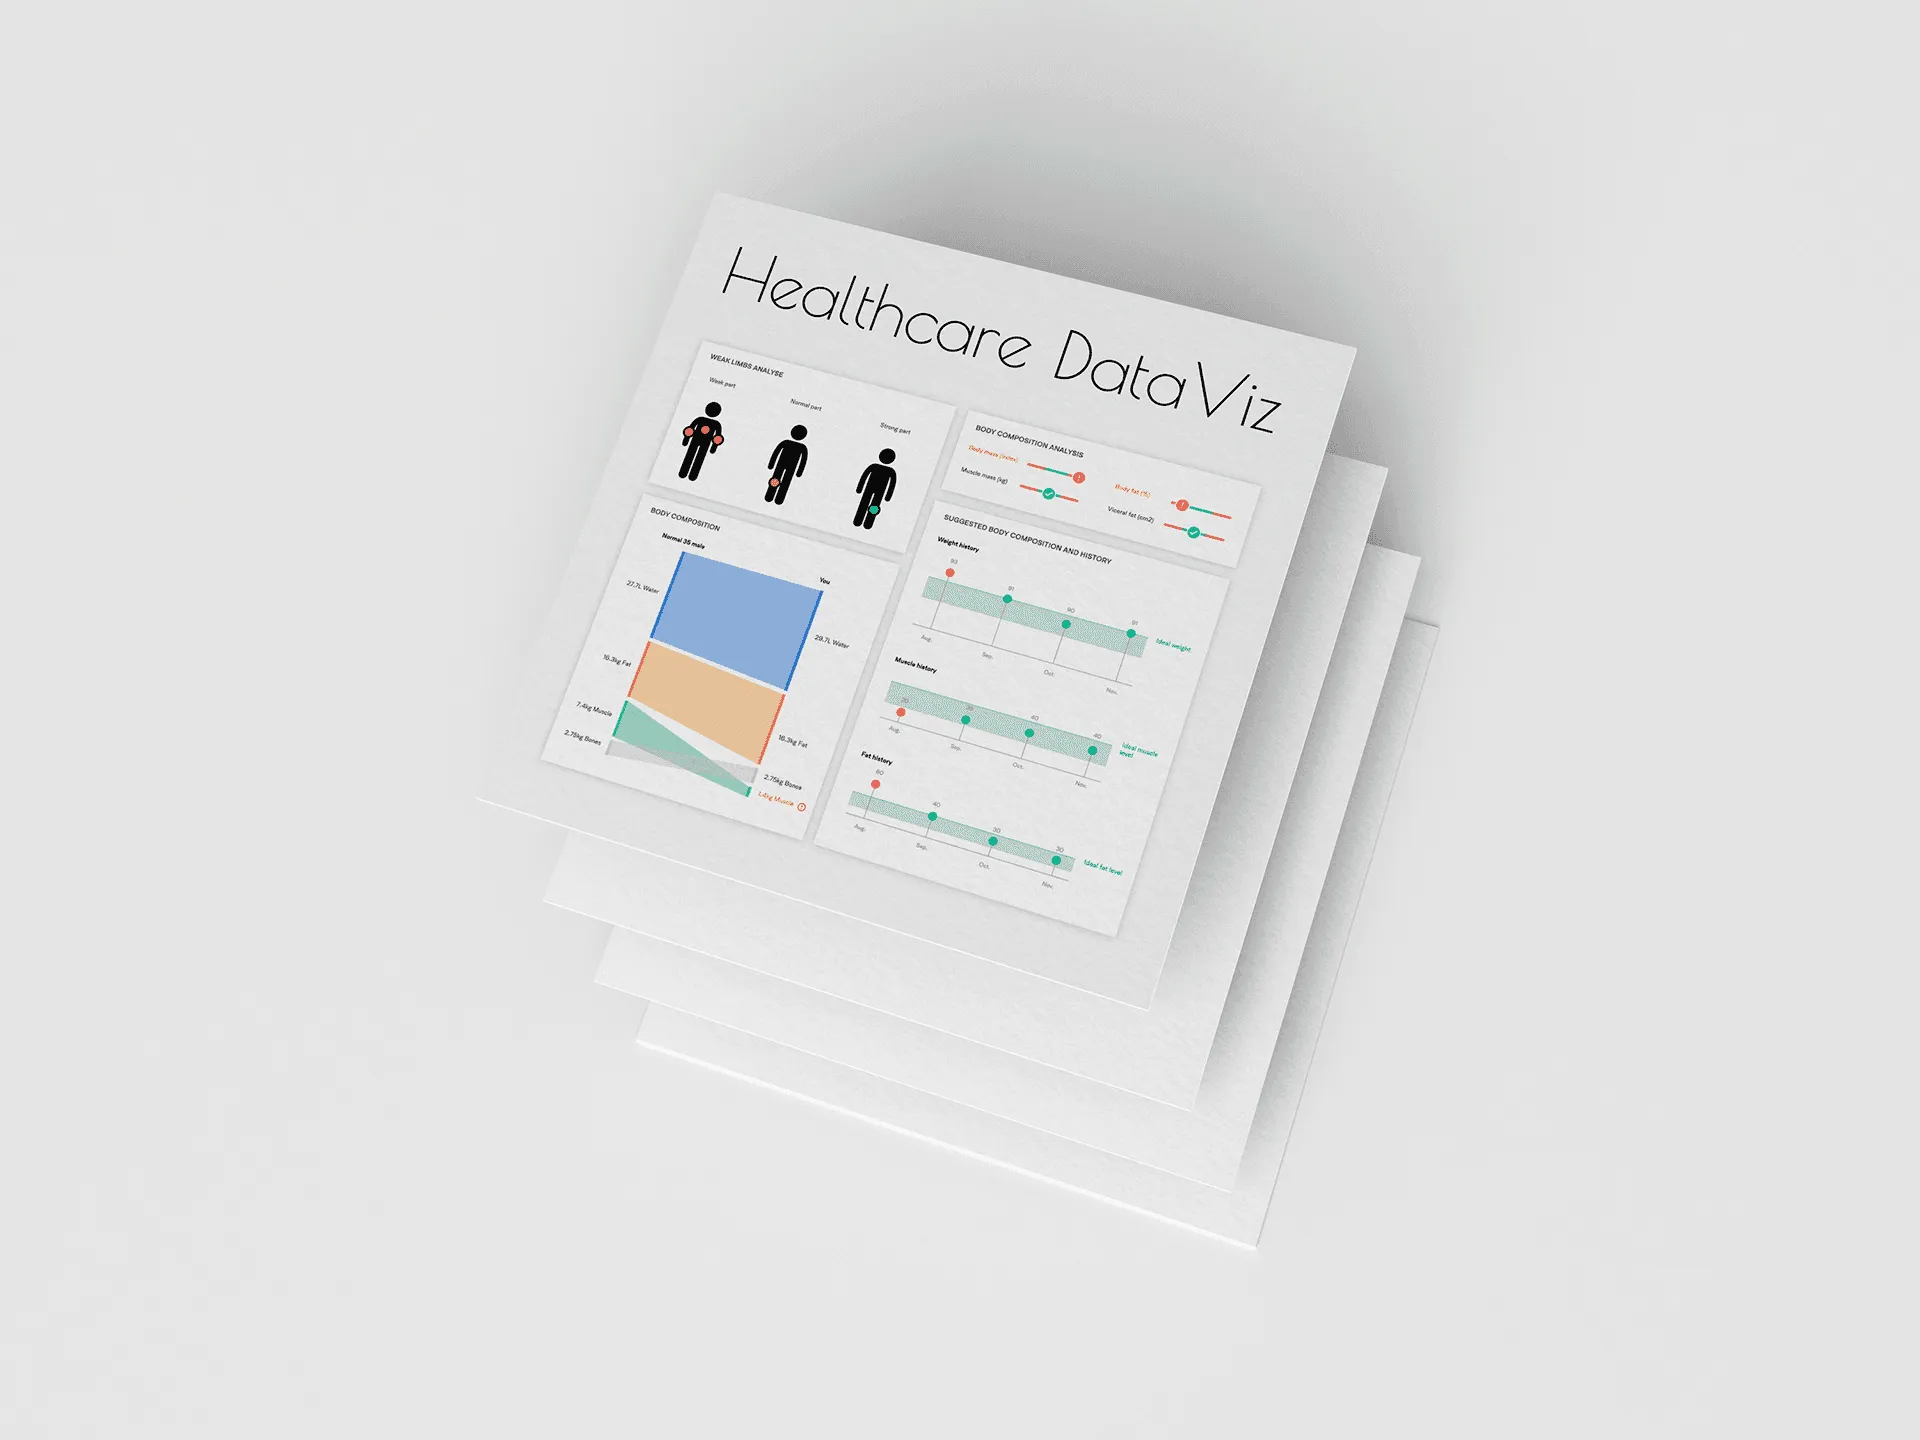
A stack of healthcare data visualisation prints

At the beginning of 2019, I got interested in DataViz. I started creating DataViz in my spare time. The design is related to my personal experience or some news’ data. I wish that by practising DataViz, I can make data to tell a story.
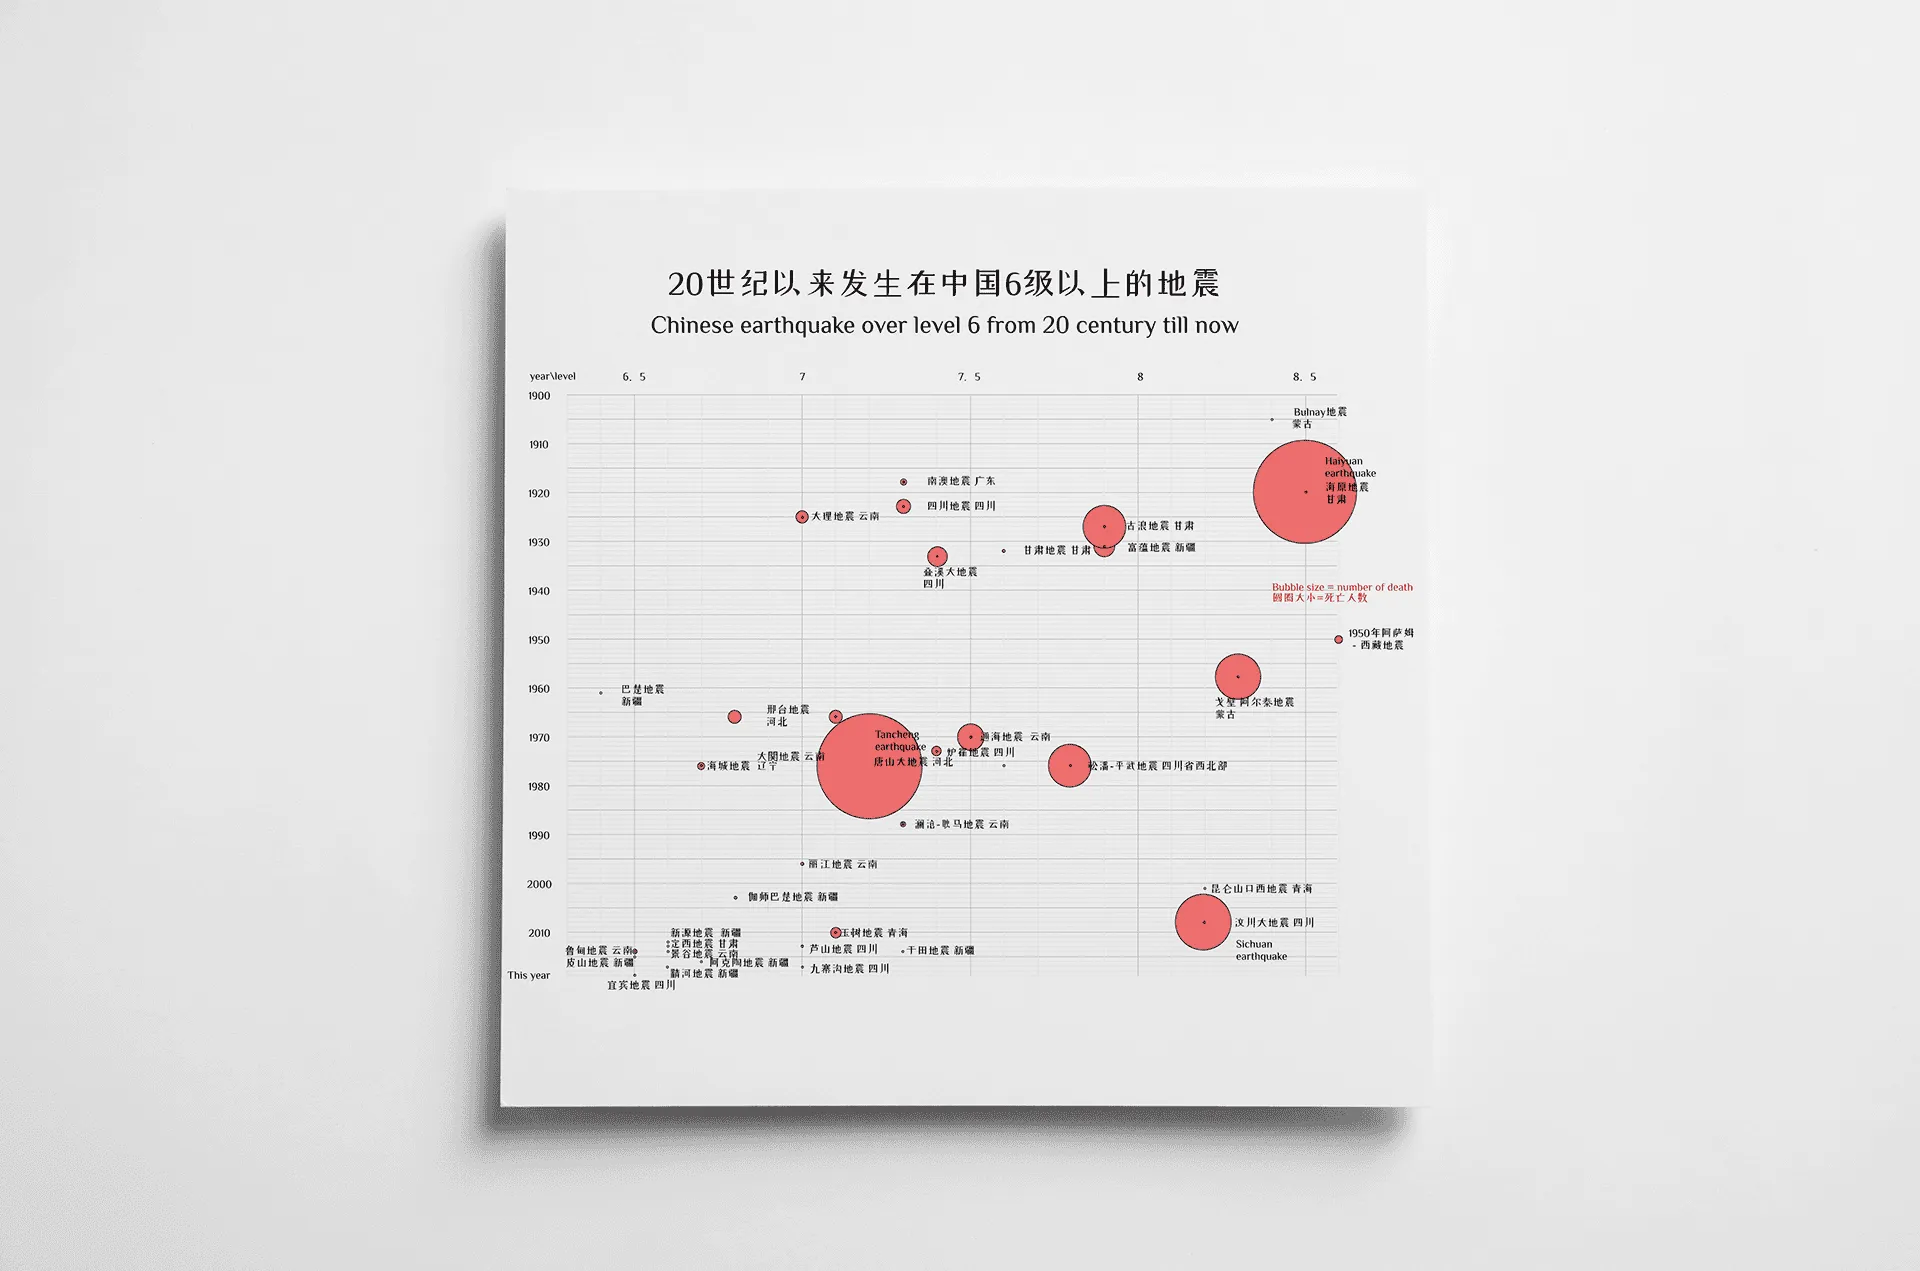
Bubble chart of earthquakes over magnitude 6 in China since the 20th century

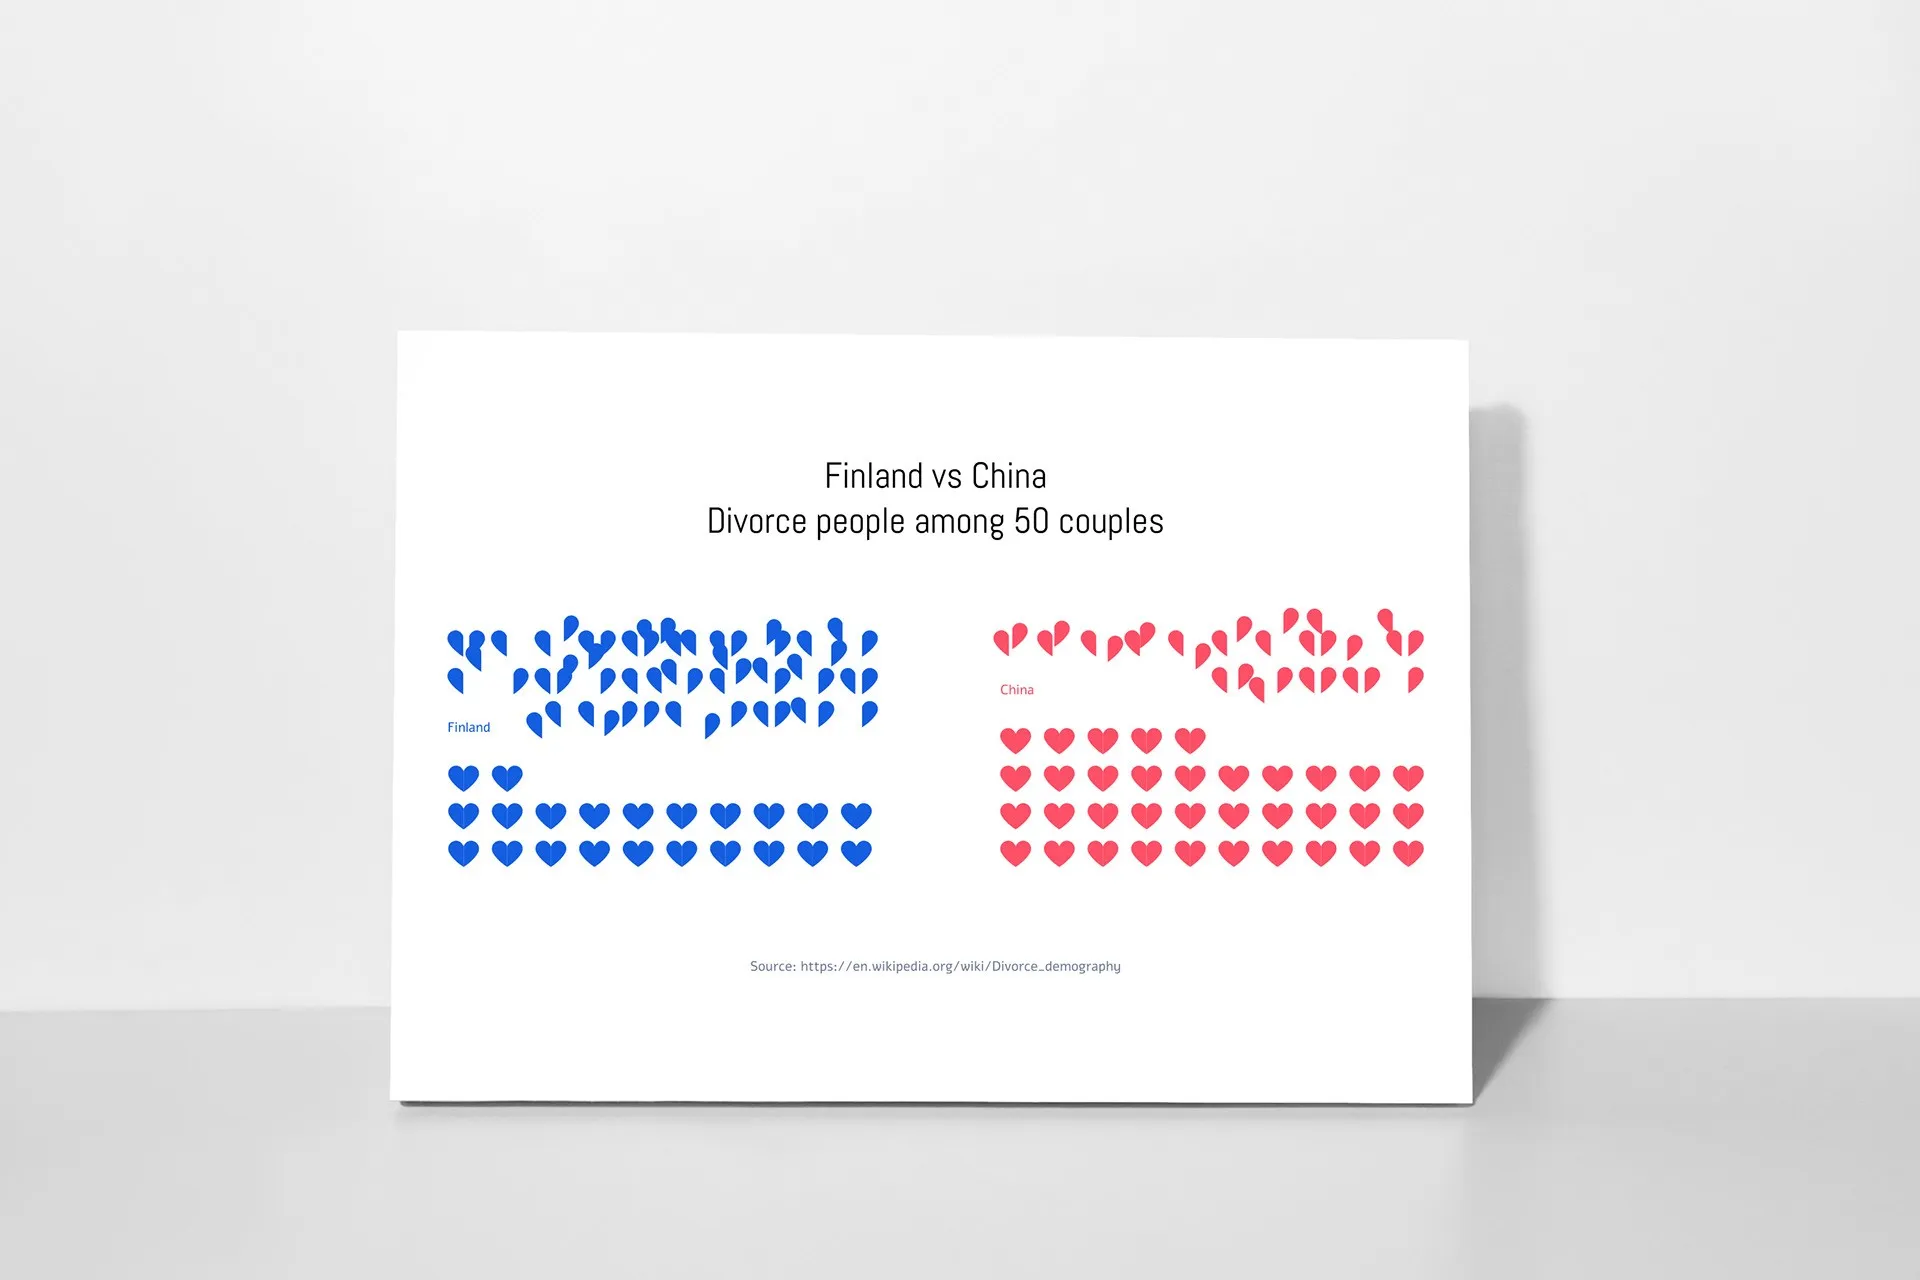
Heart icons comparing divorce rates among 50 couples in Finland and China

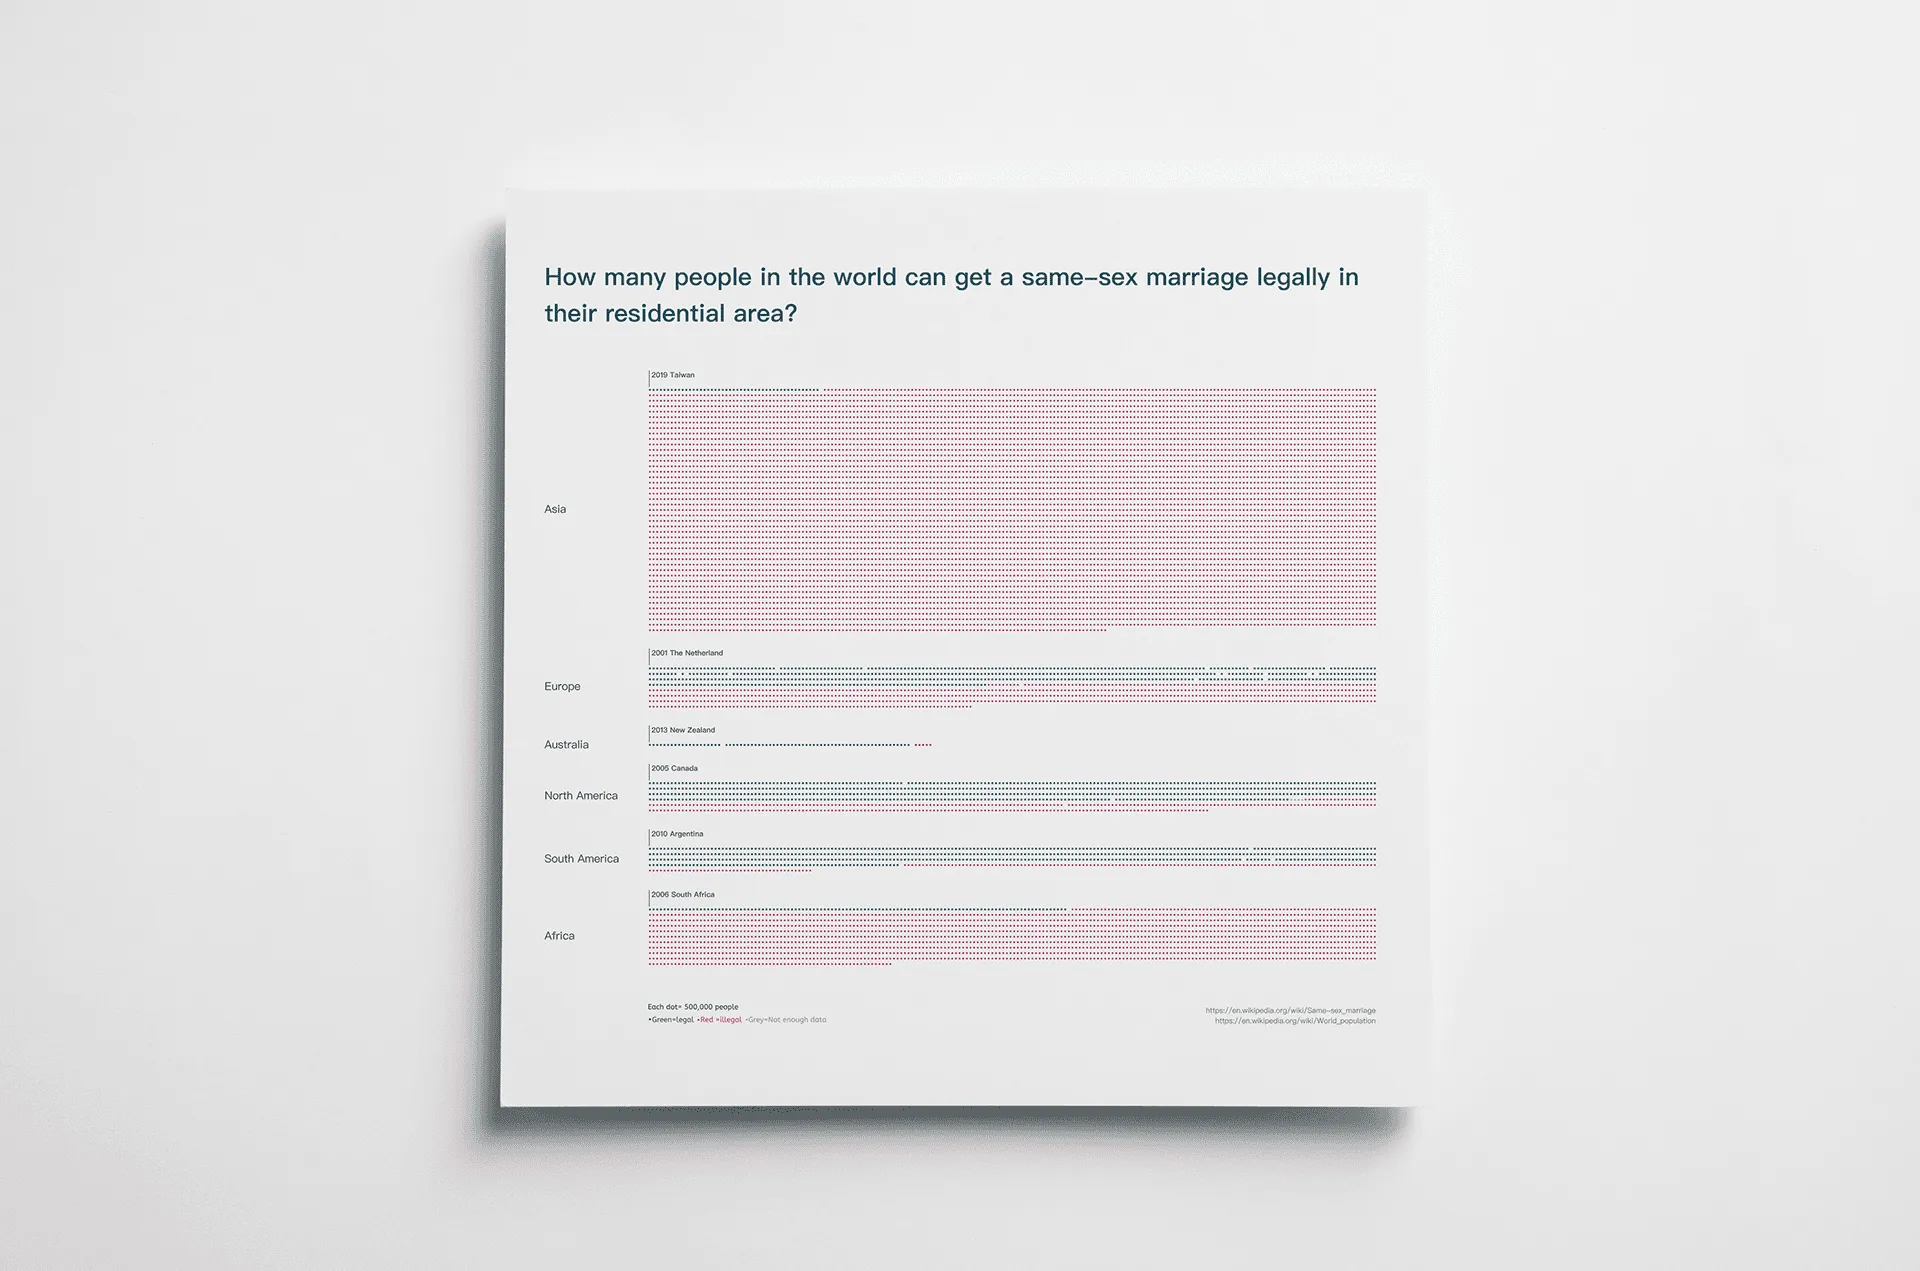
Chart of how many people in the world can legally get a same-sex marriage where they live

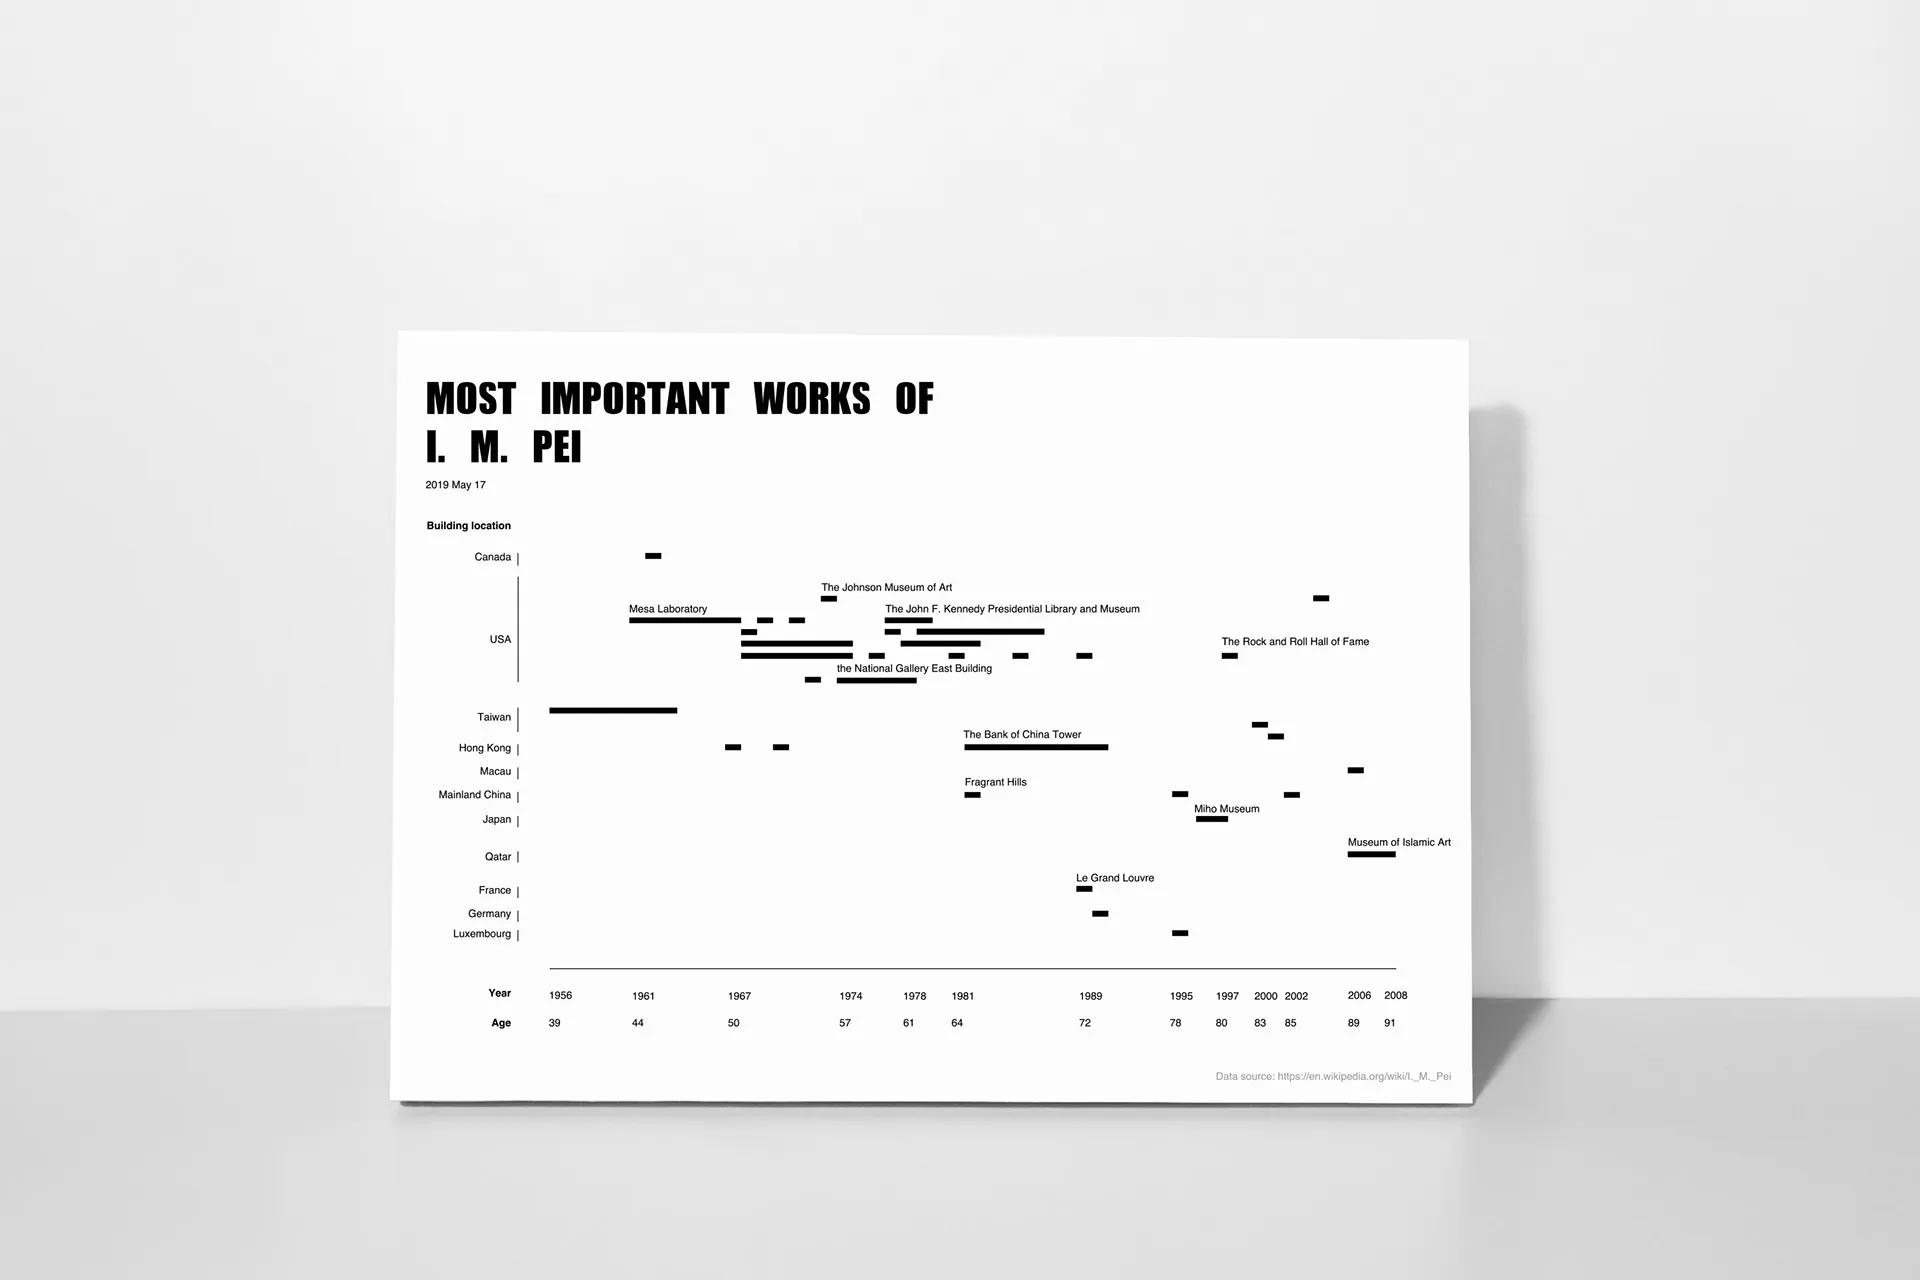
Timeline of the most important works of architect I. M. Pei

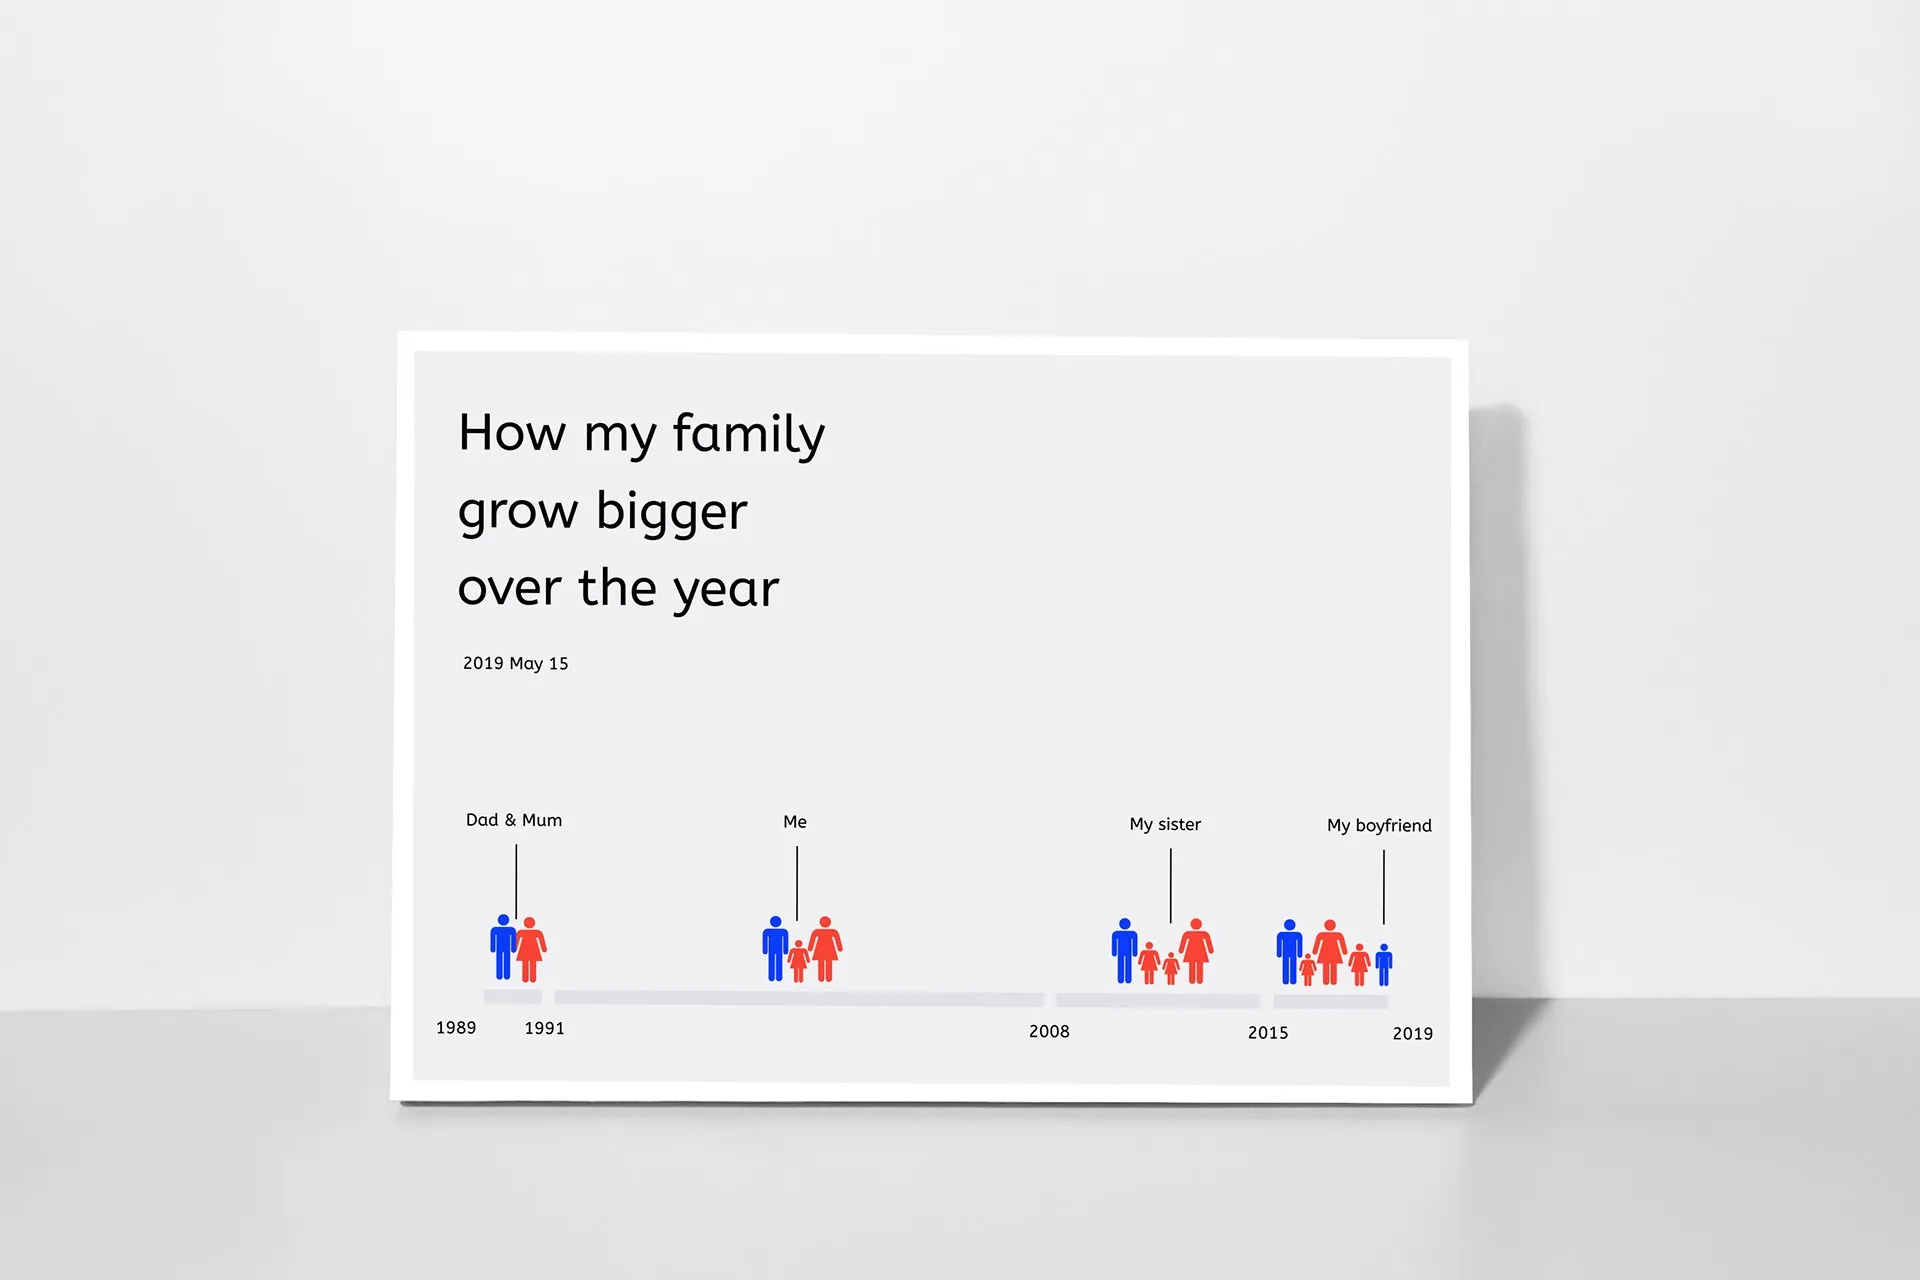
Timeline showing how my family grew bigger over the years

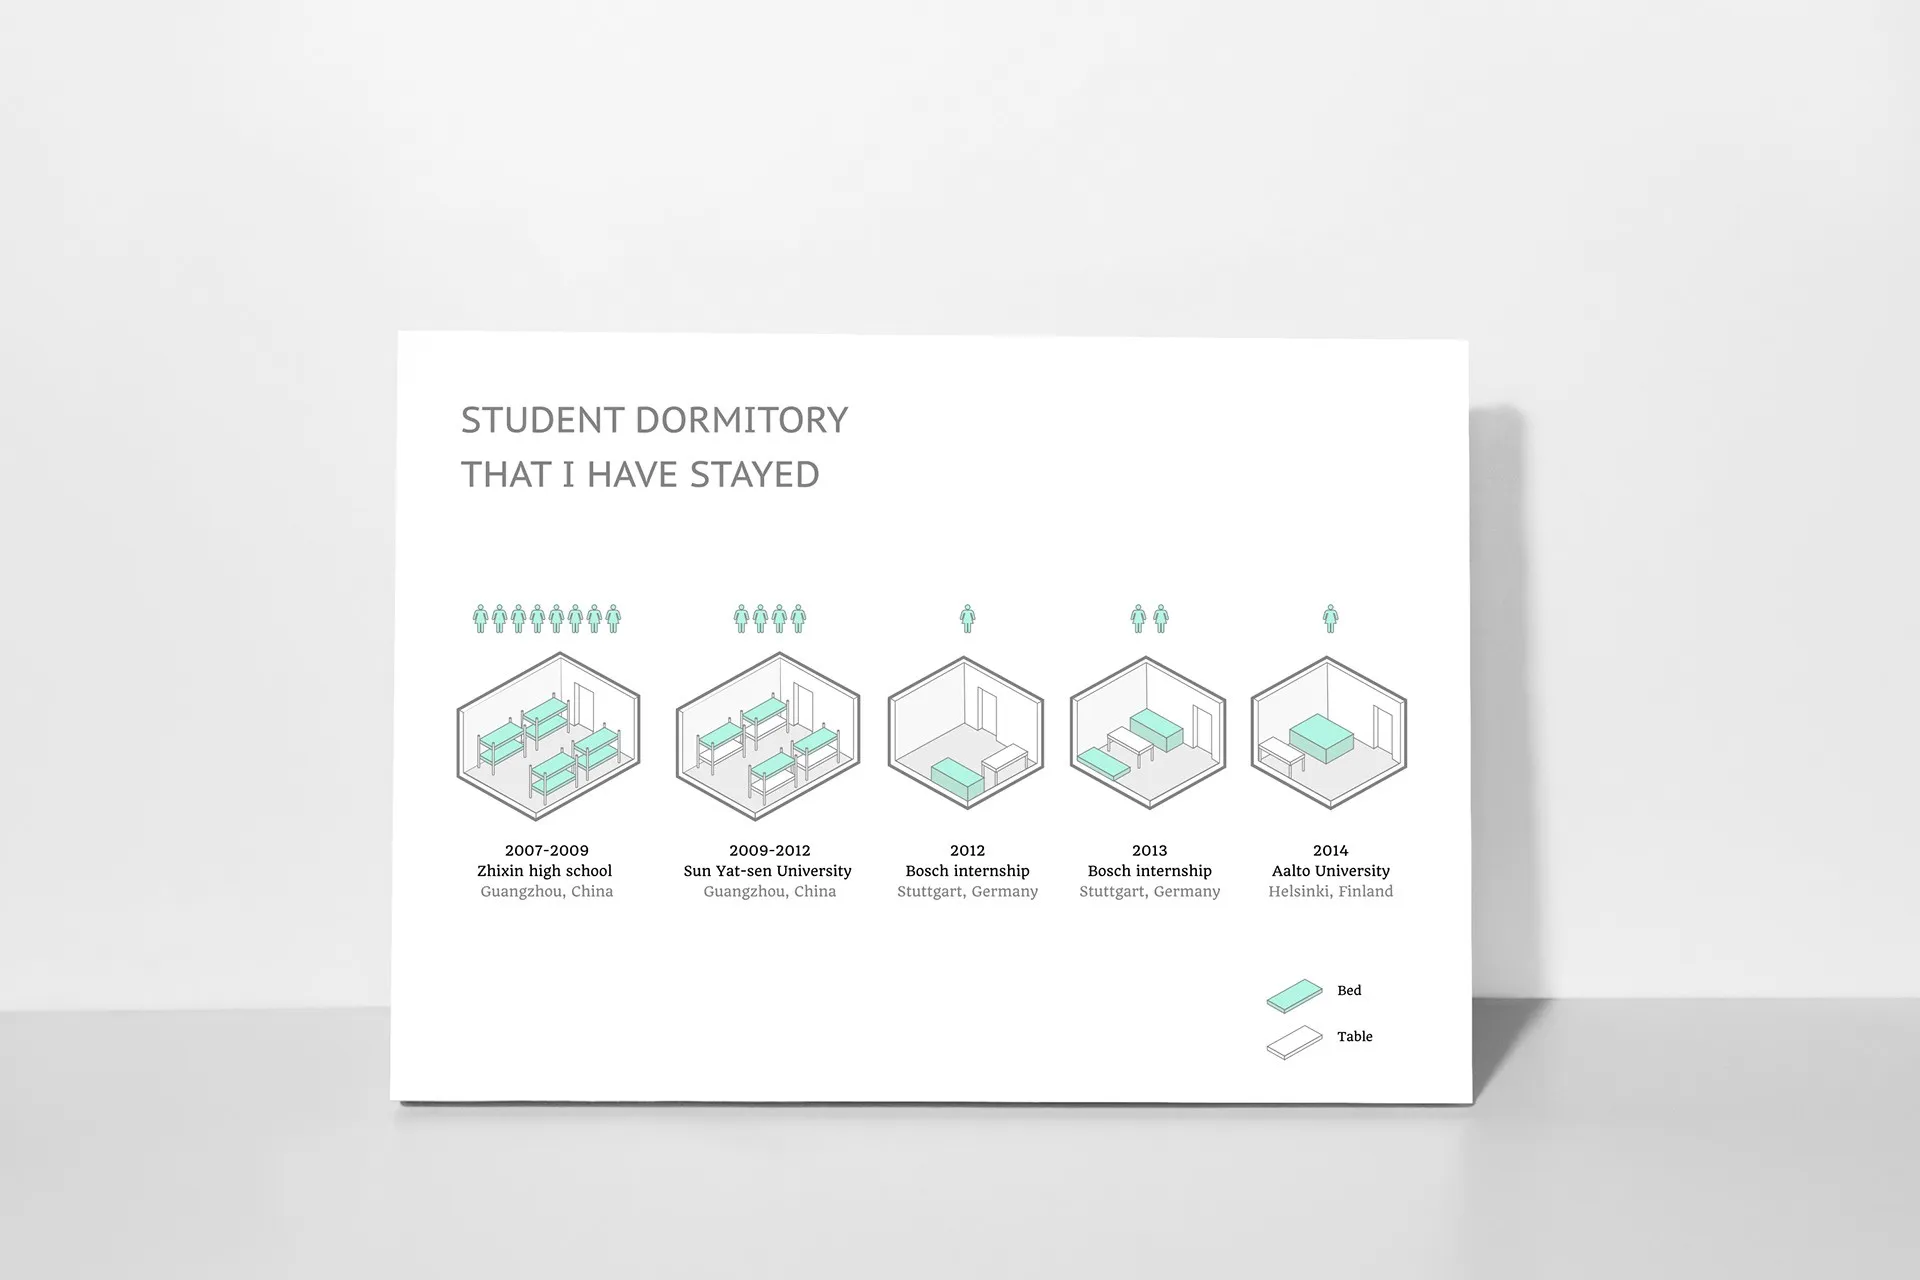
Isometric drawings of the student dormitories I have stayed in

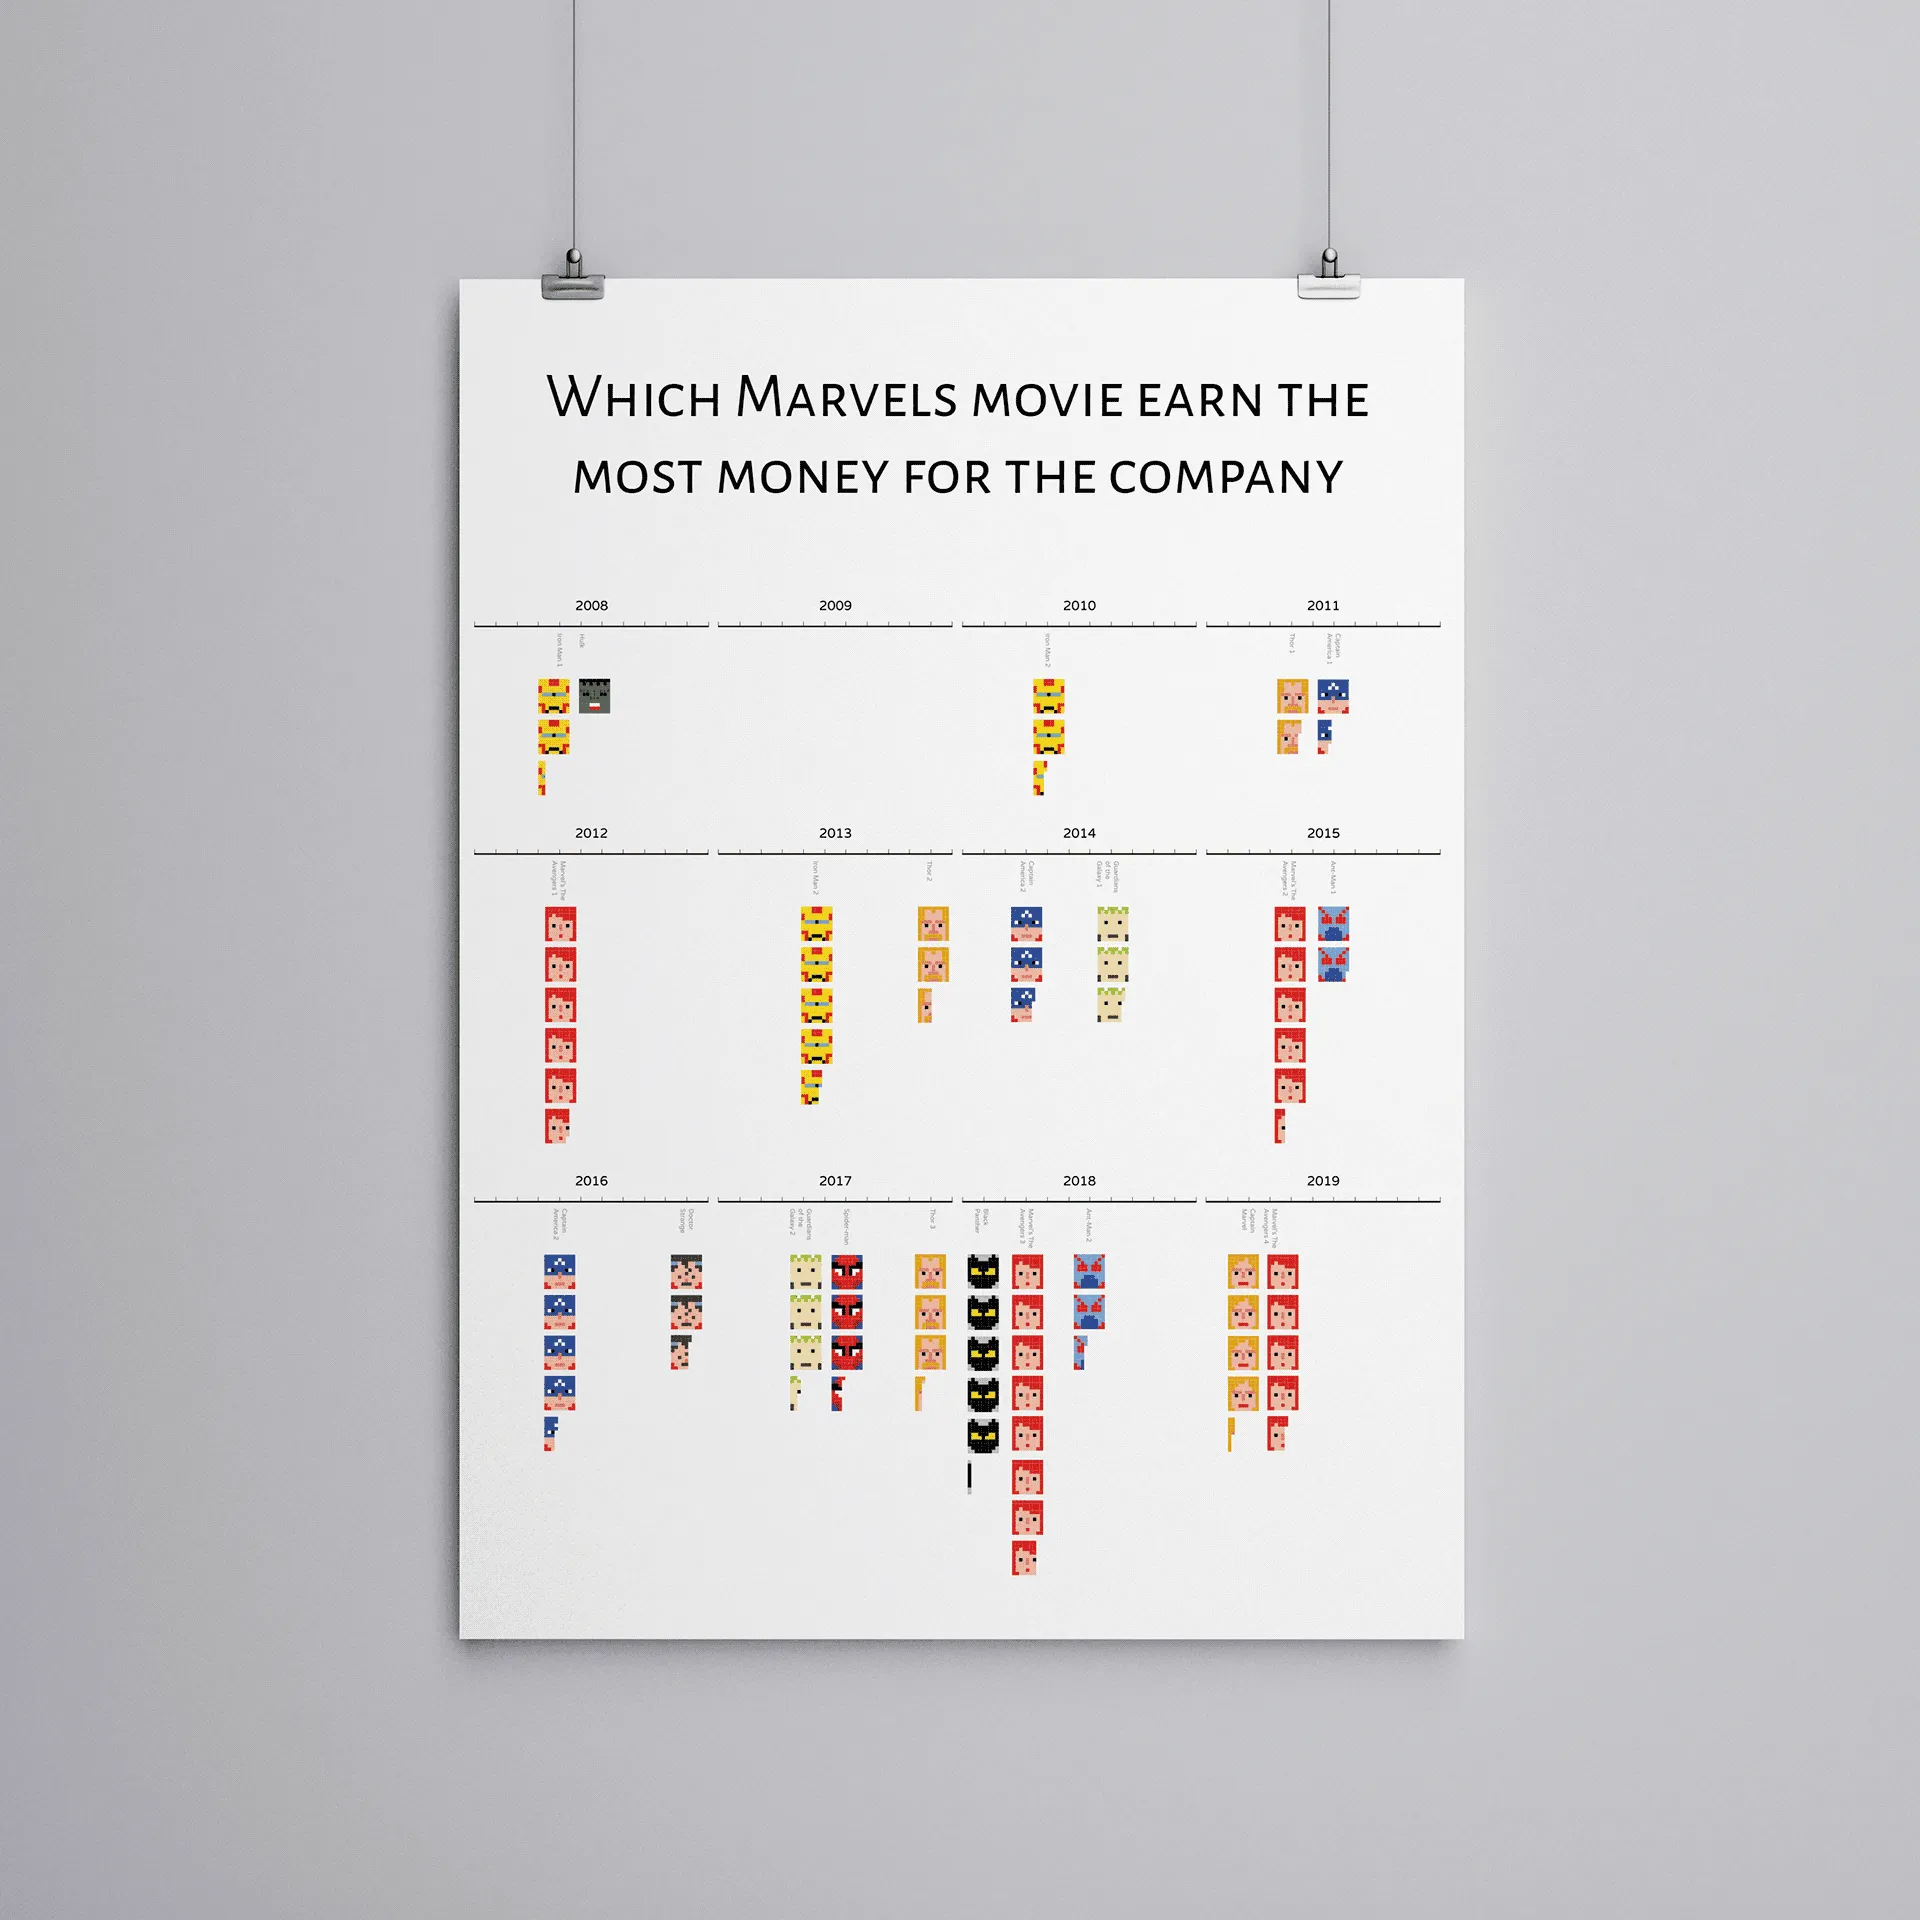
Poster comparing which Marvel movies earned the most money

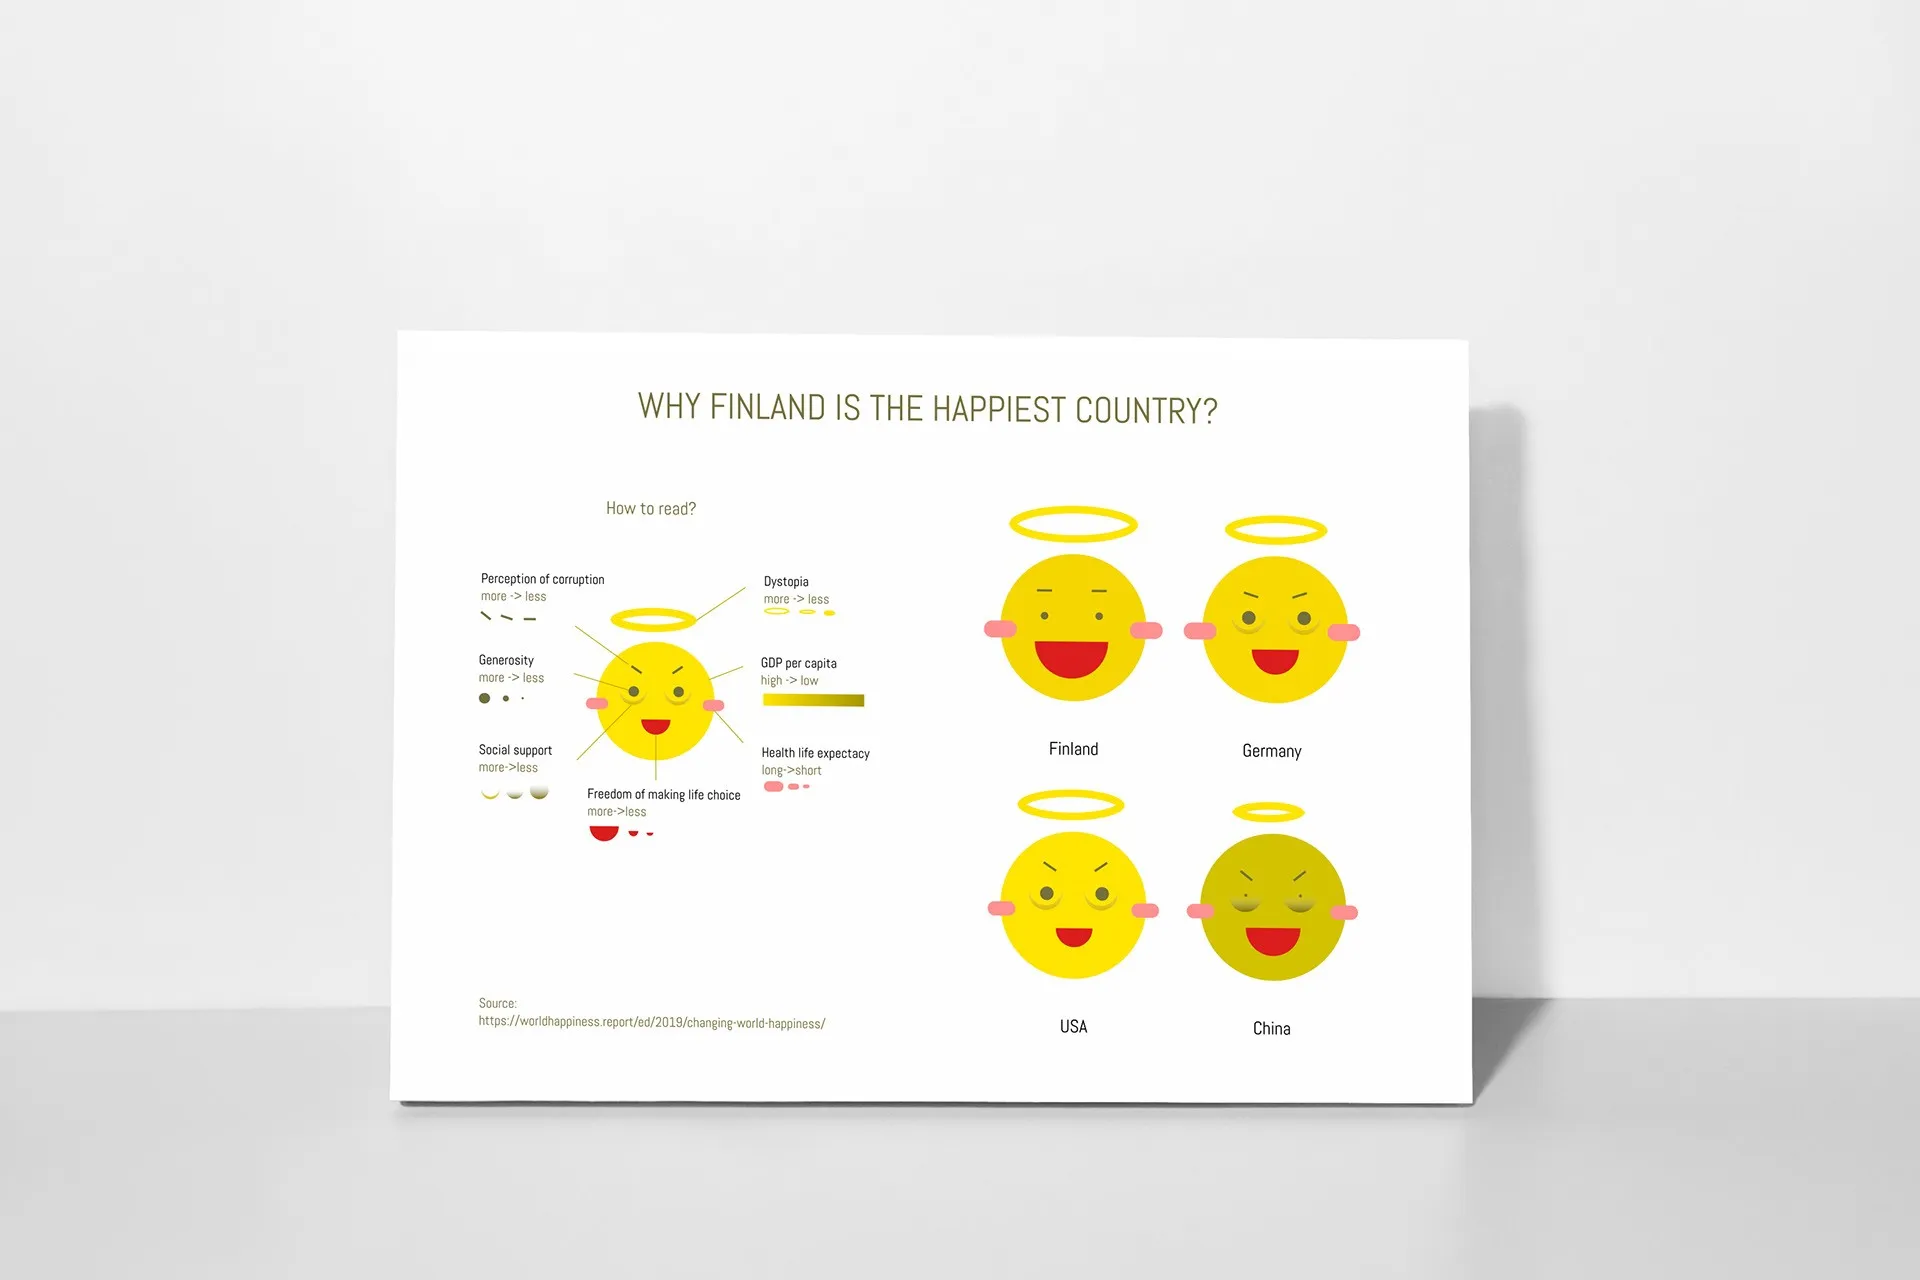
Smiley-face chart explaining why Finland is the happiest country

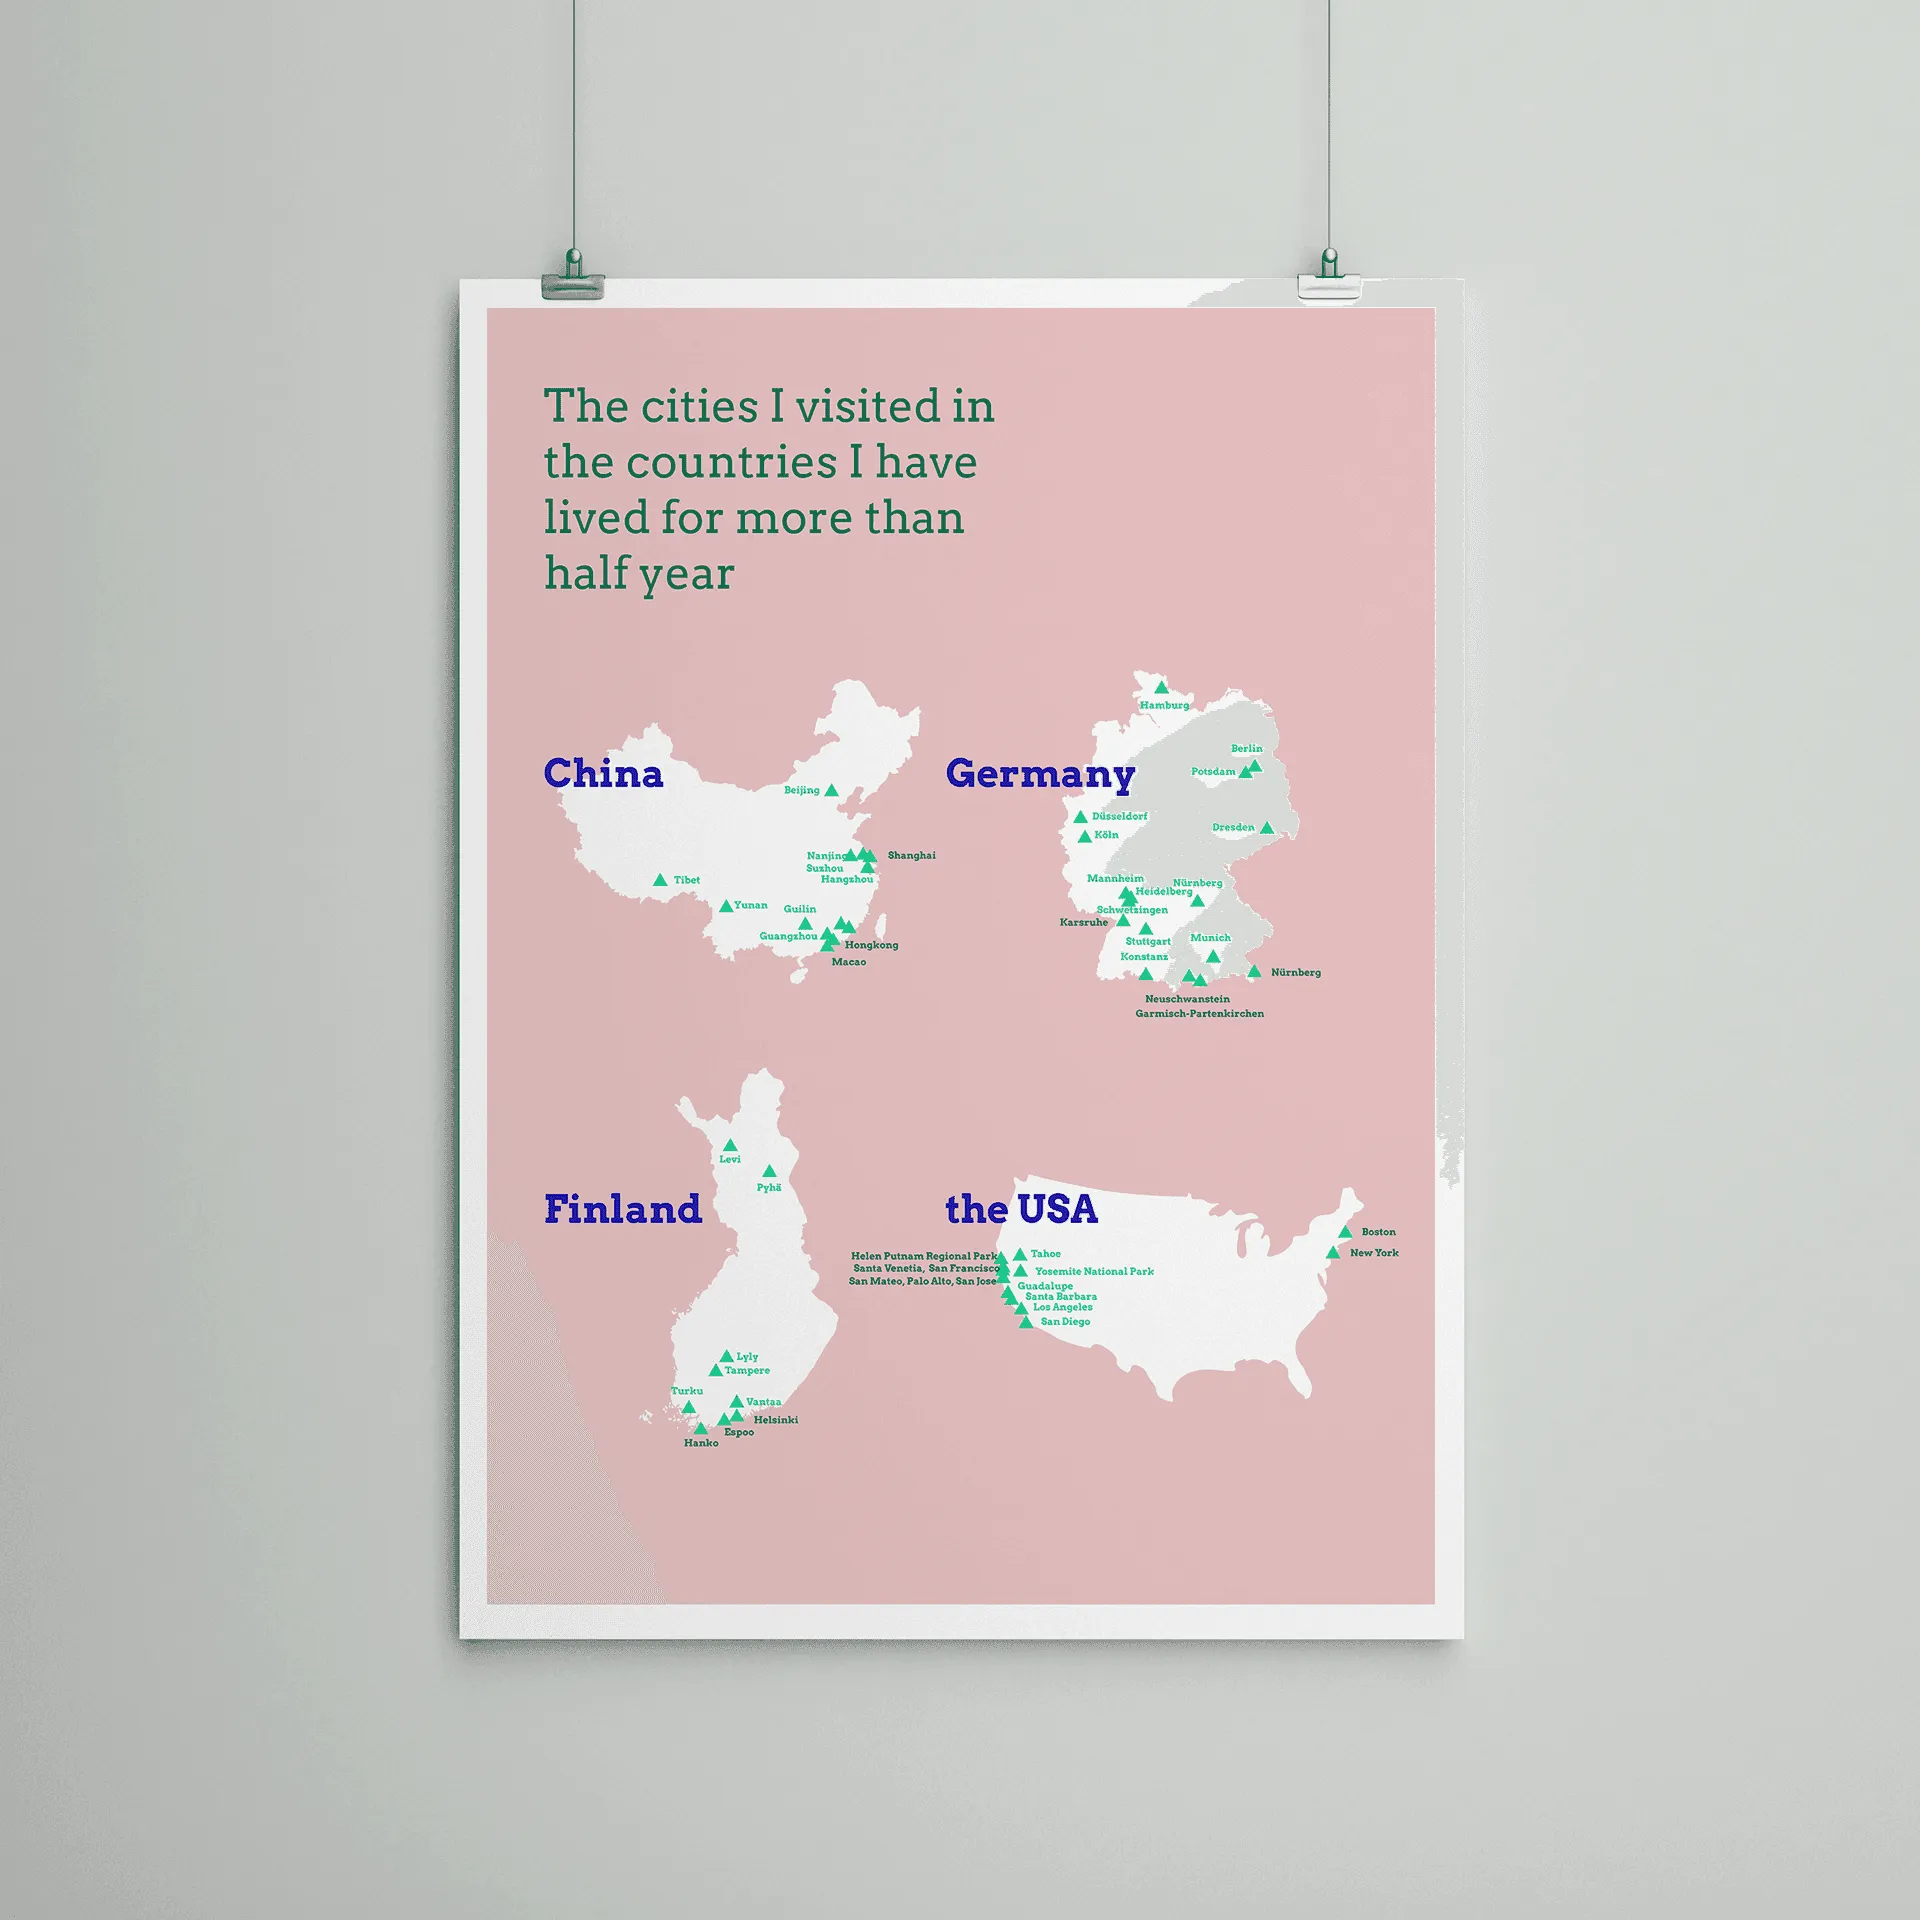
Maps of the cities I visited in China, Germany, Finland and the USA

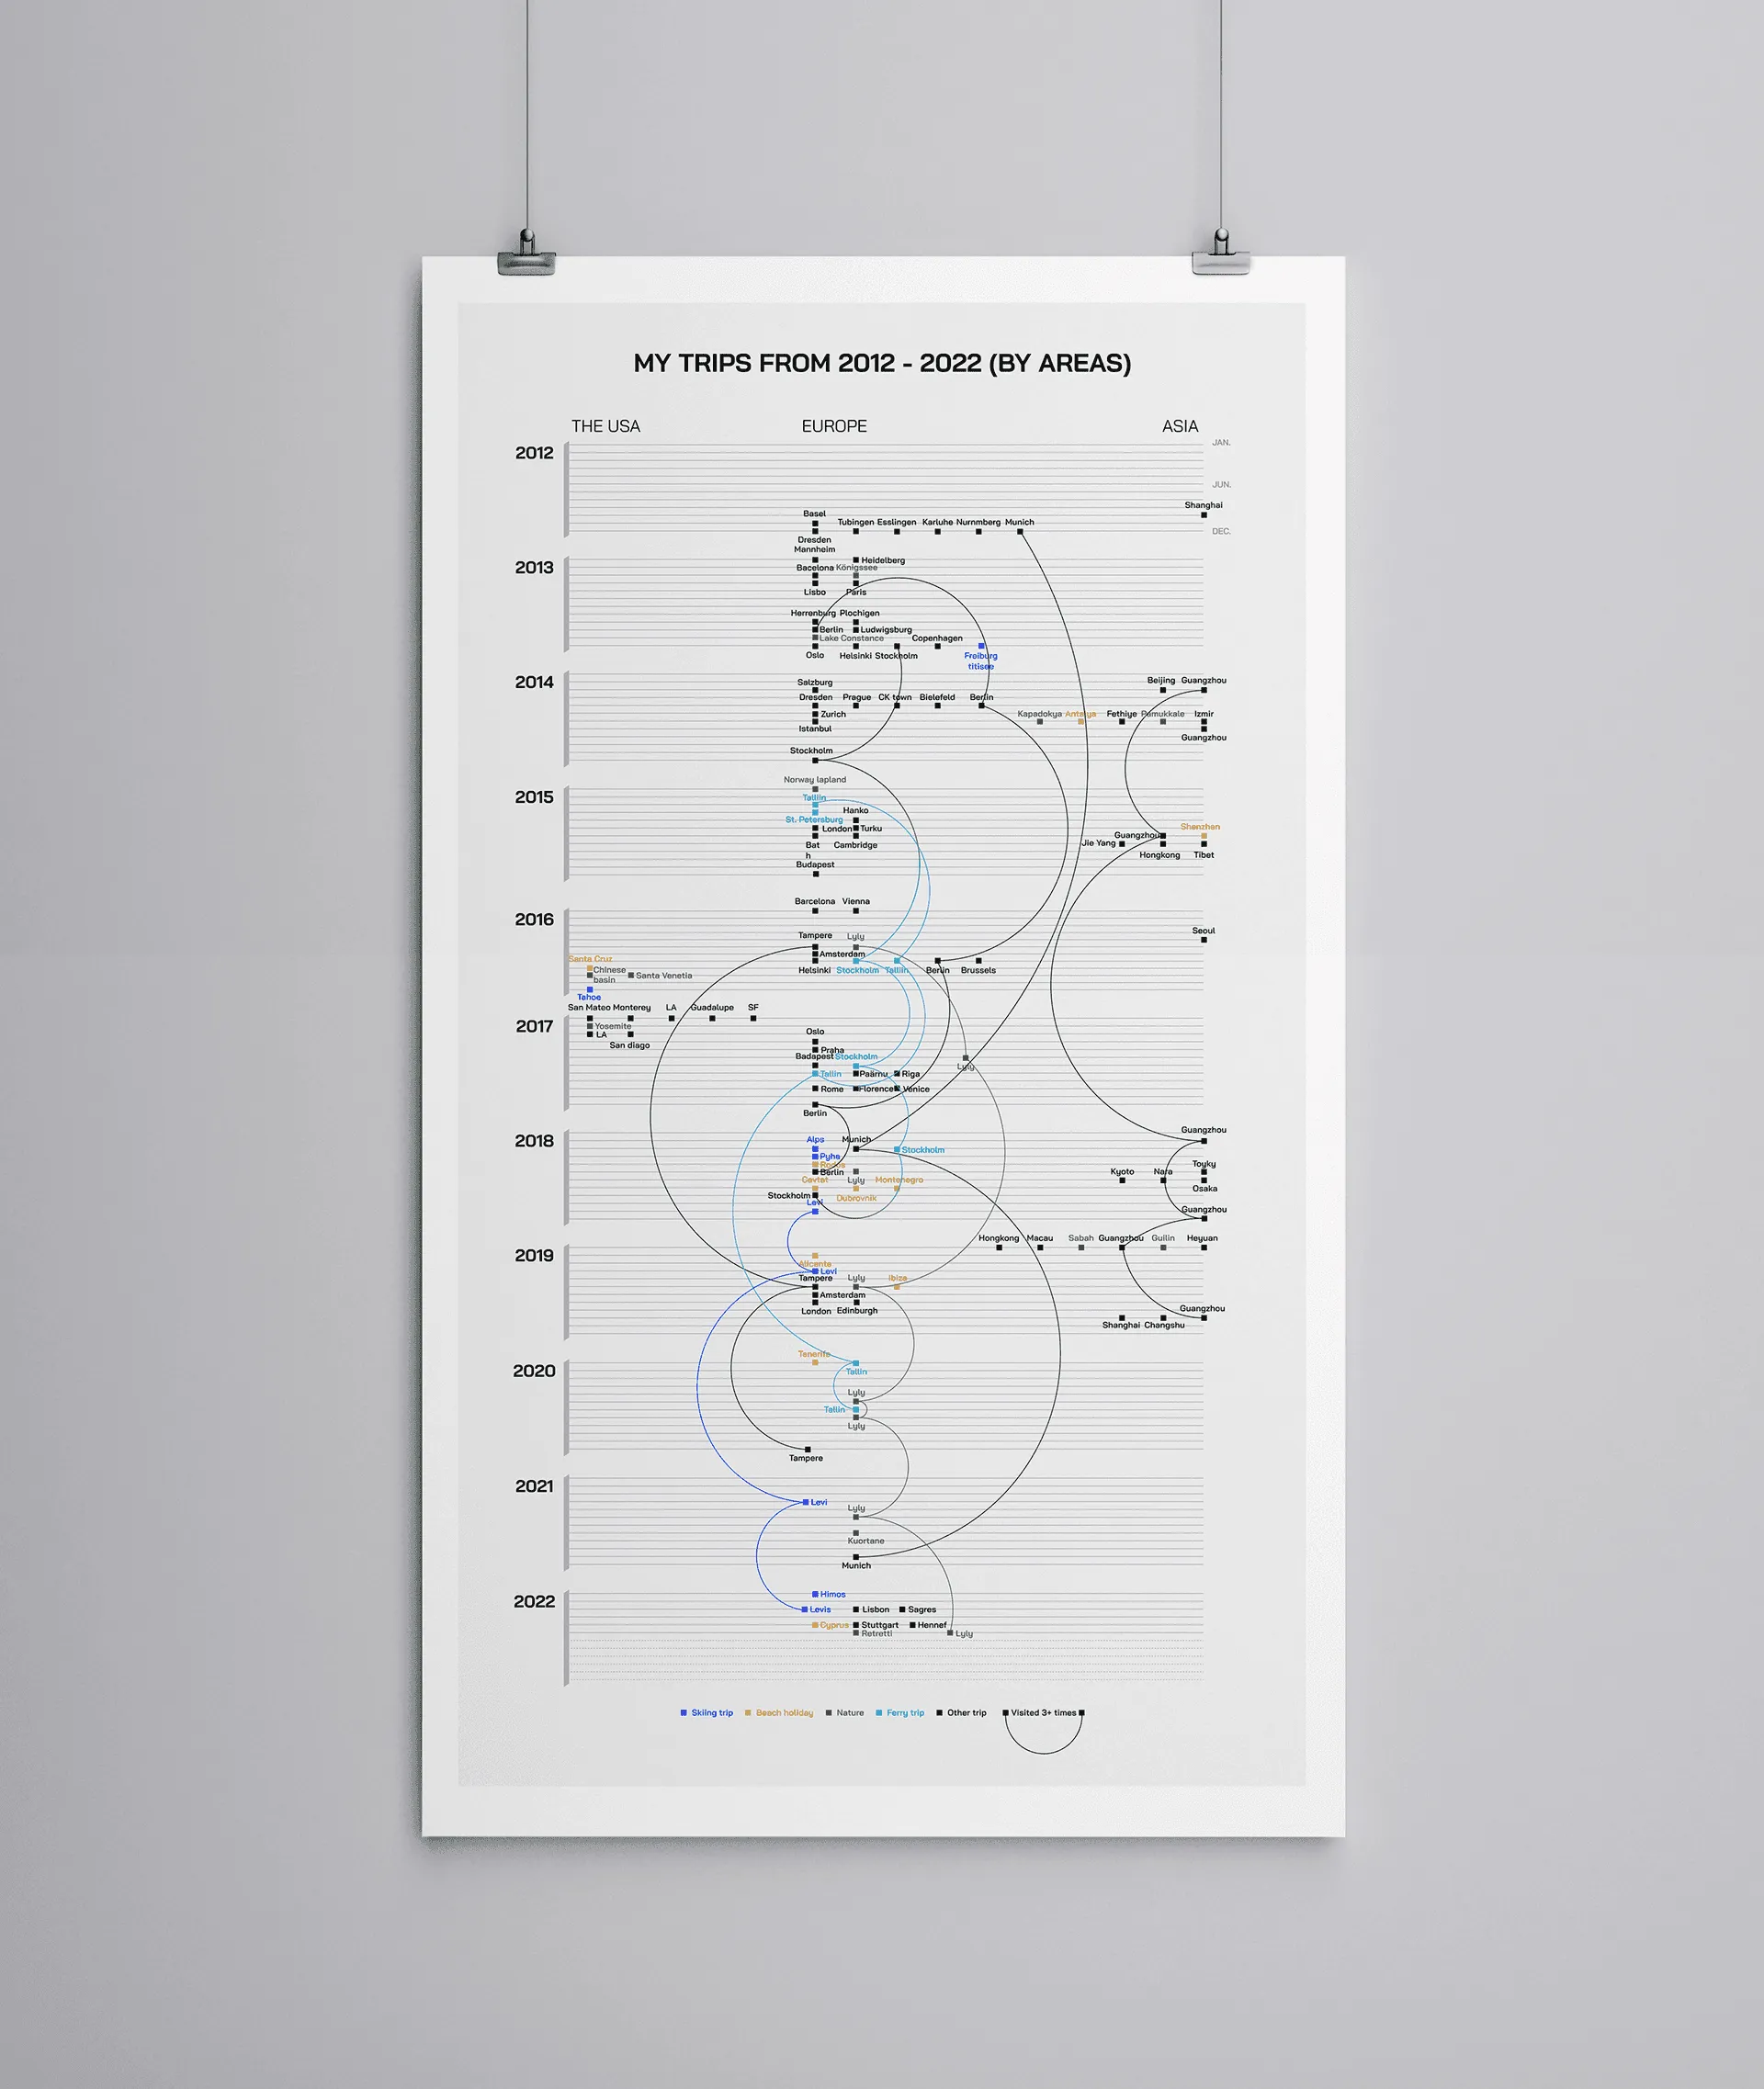
Poster of my trips from 2012 to 2022 by airplane

The last graphic was previously created in 2019. After 3 years of epidemic, I am curious to see how much less travel I have done during the time. What I find out is that I travel more inside Finland. Besides, it has been 2 and half years since last time I visited China. Now the situation gets better, hopefully I can travel more again : -)