Neosmart Health
- Date
Background
We were working for a technology startup operating in the preventive healthcare business. Unlike traditional health care, the startup uses self-assessment data, selected medical and environmental analysis, and genetic data to create personalised recommendations and a plan to improve the client’s health.
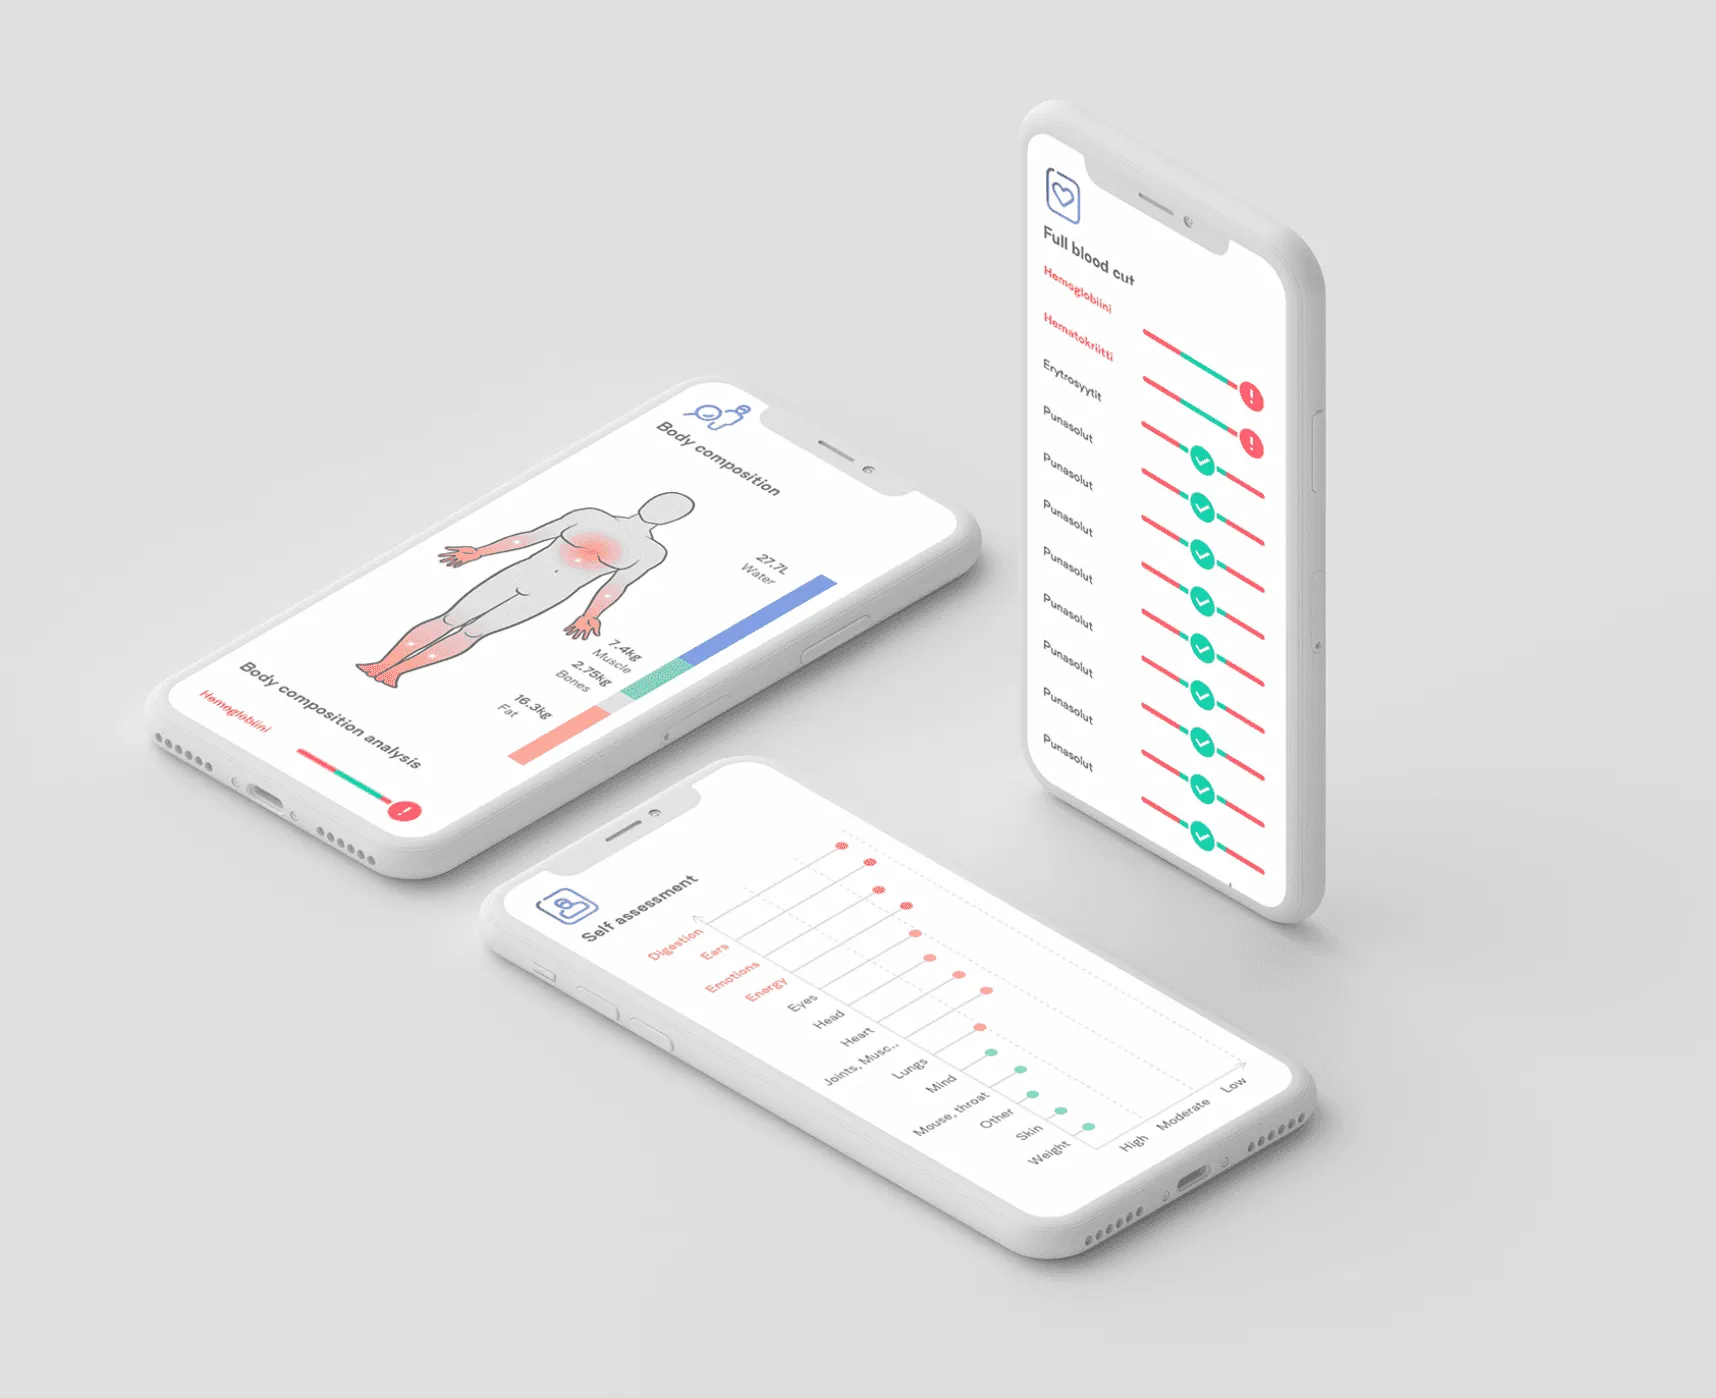
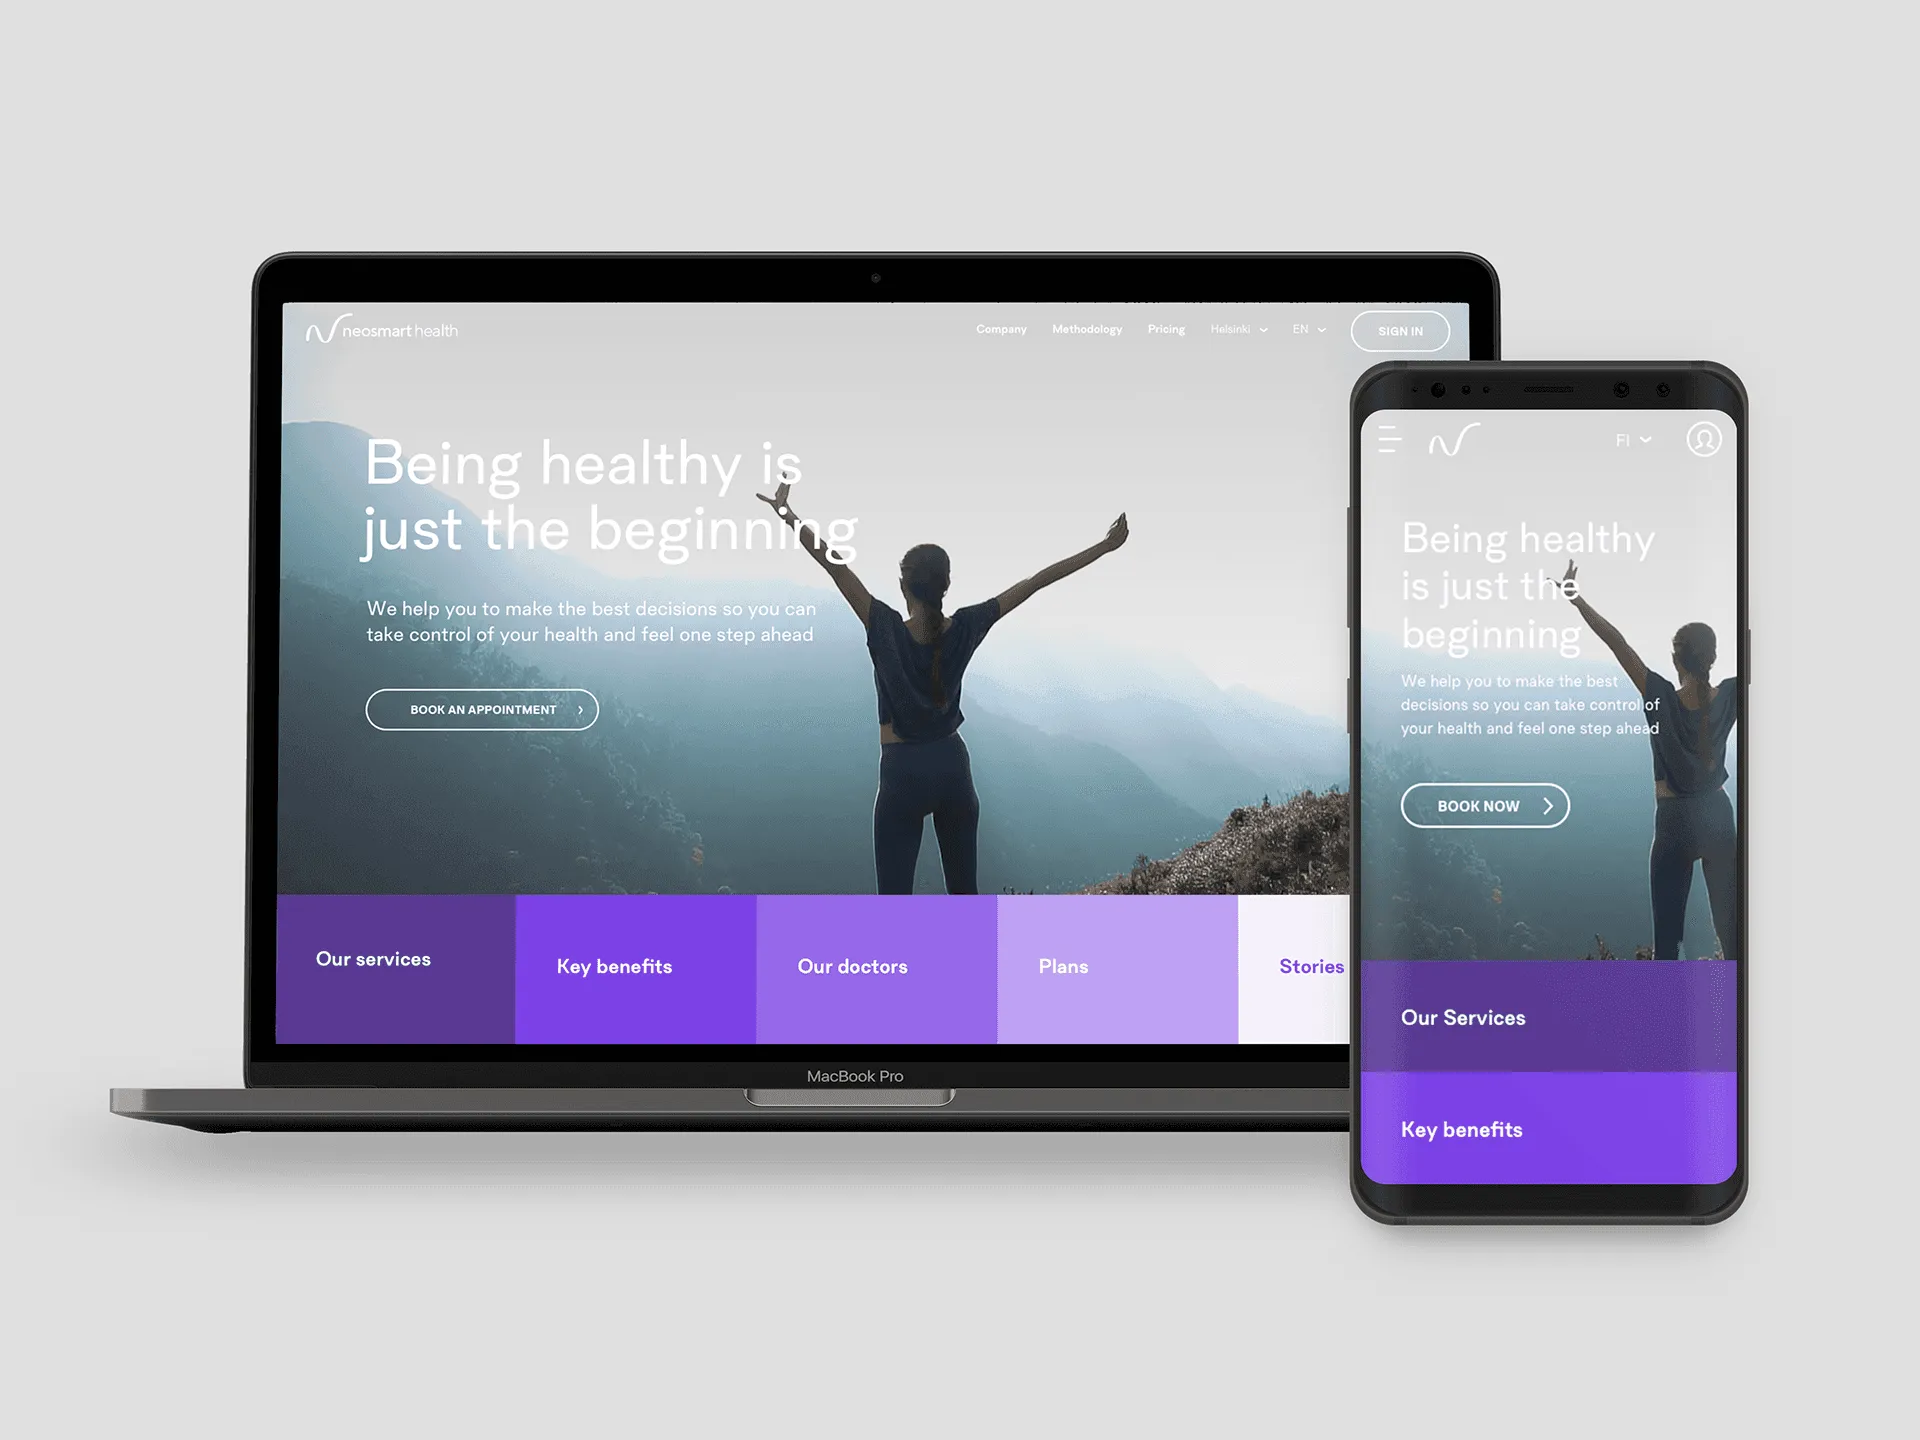
This project aims at providing the client’s customers with a digital service with a consistent customer experience. Started from scratch, we’ve designed and launched a website. This website explains the service and functioning as an online portal. The portal serves as an easy booking system to make a smooth online-offline experience and a dashboard to monitor visualised health data.
The project team consist of developers and designers, some business stakeholders and medical experts from our client.
My task
- Information architecture.
- Design guideline.
3. Data visualisation. 4. Part of some visual design. 5. Prototype.
For the end users, there are a lot of health data available for them. However, the numbers are weight too much and not so intuitive to understand. By visualizing the data with color and scale, we can easily show to the users how is it going with their health situation and point out which area they need to work on in order to improve it.
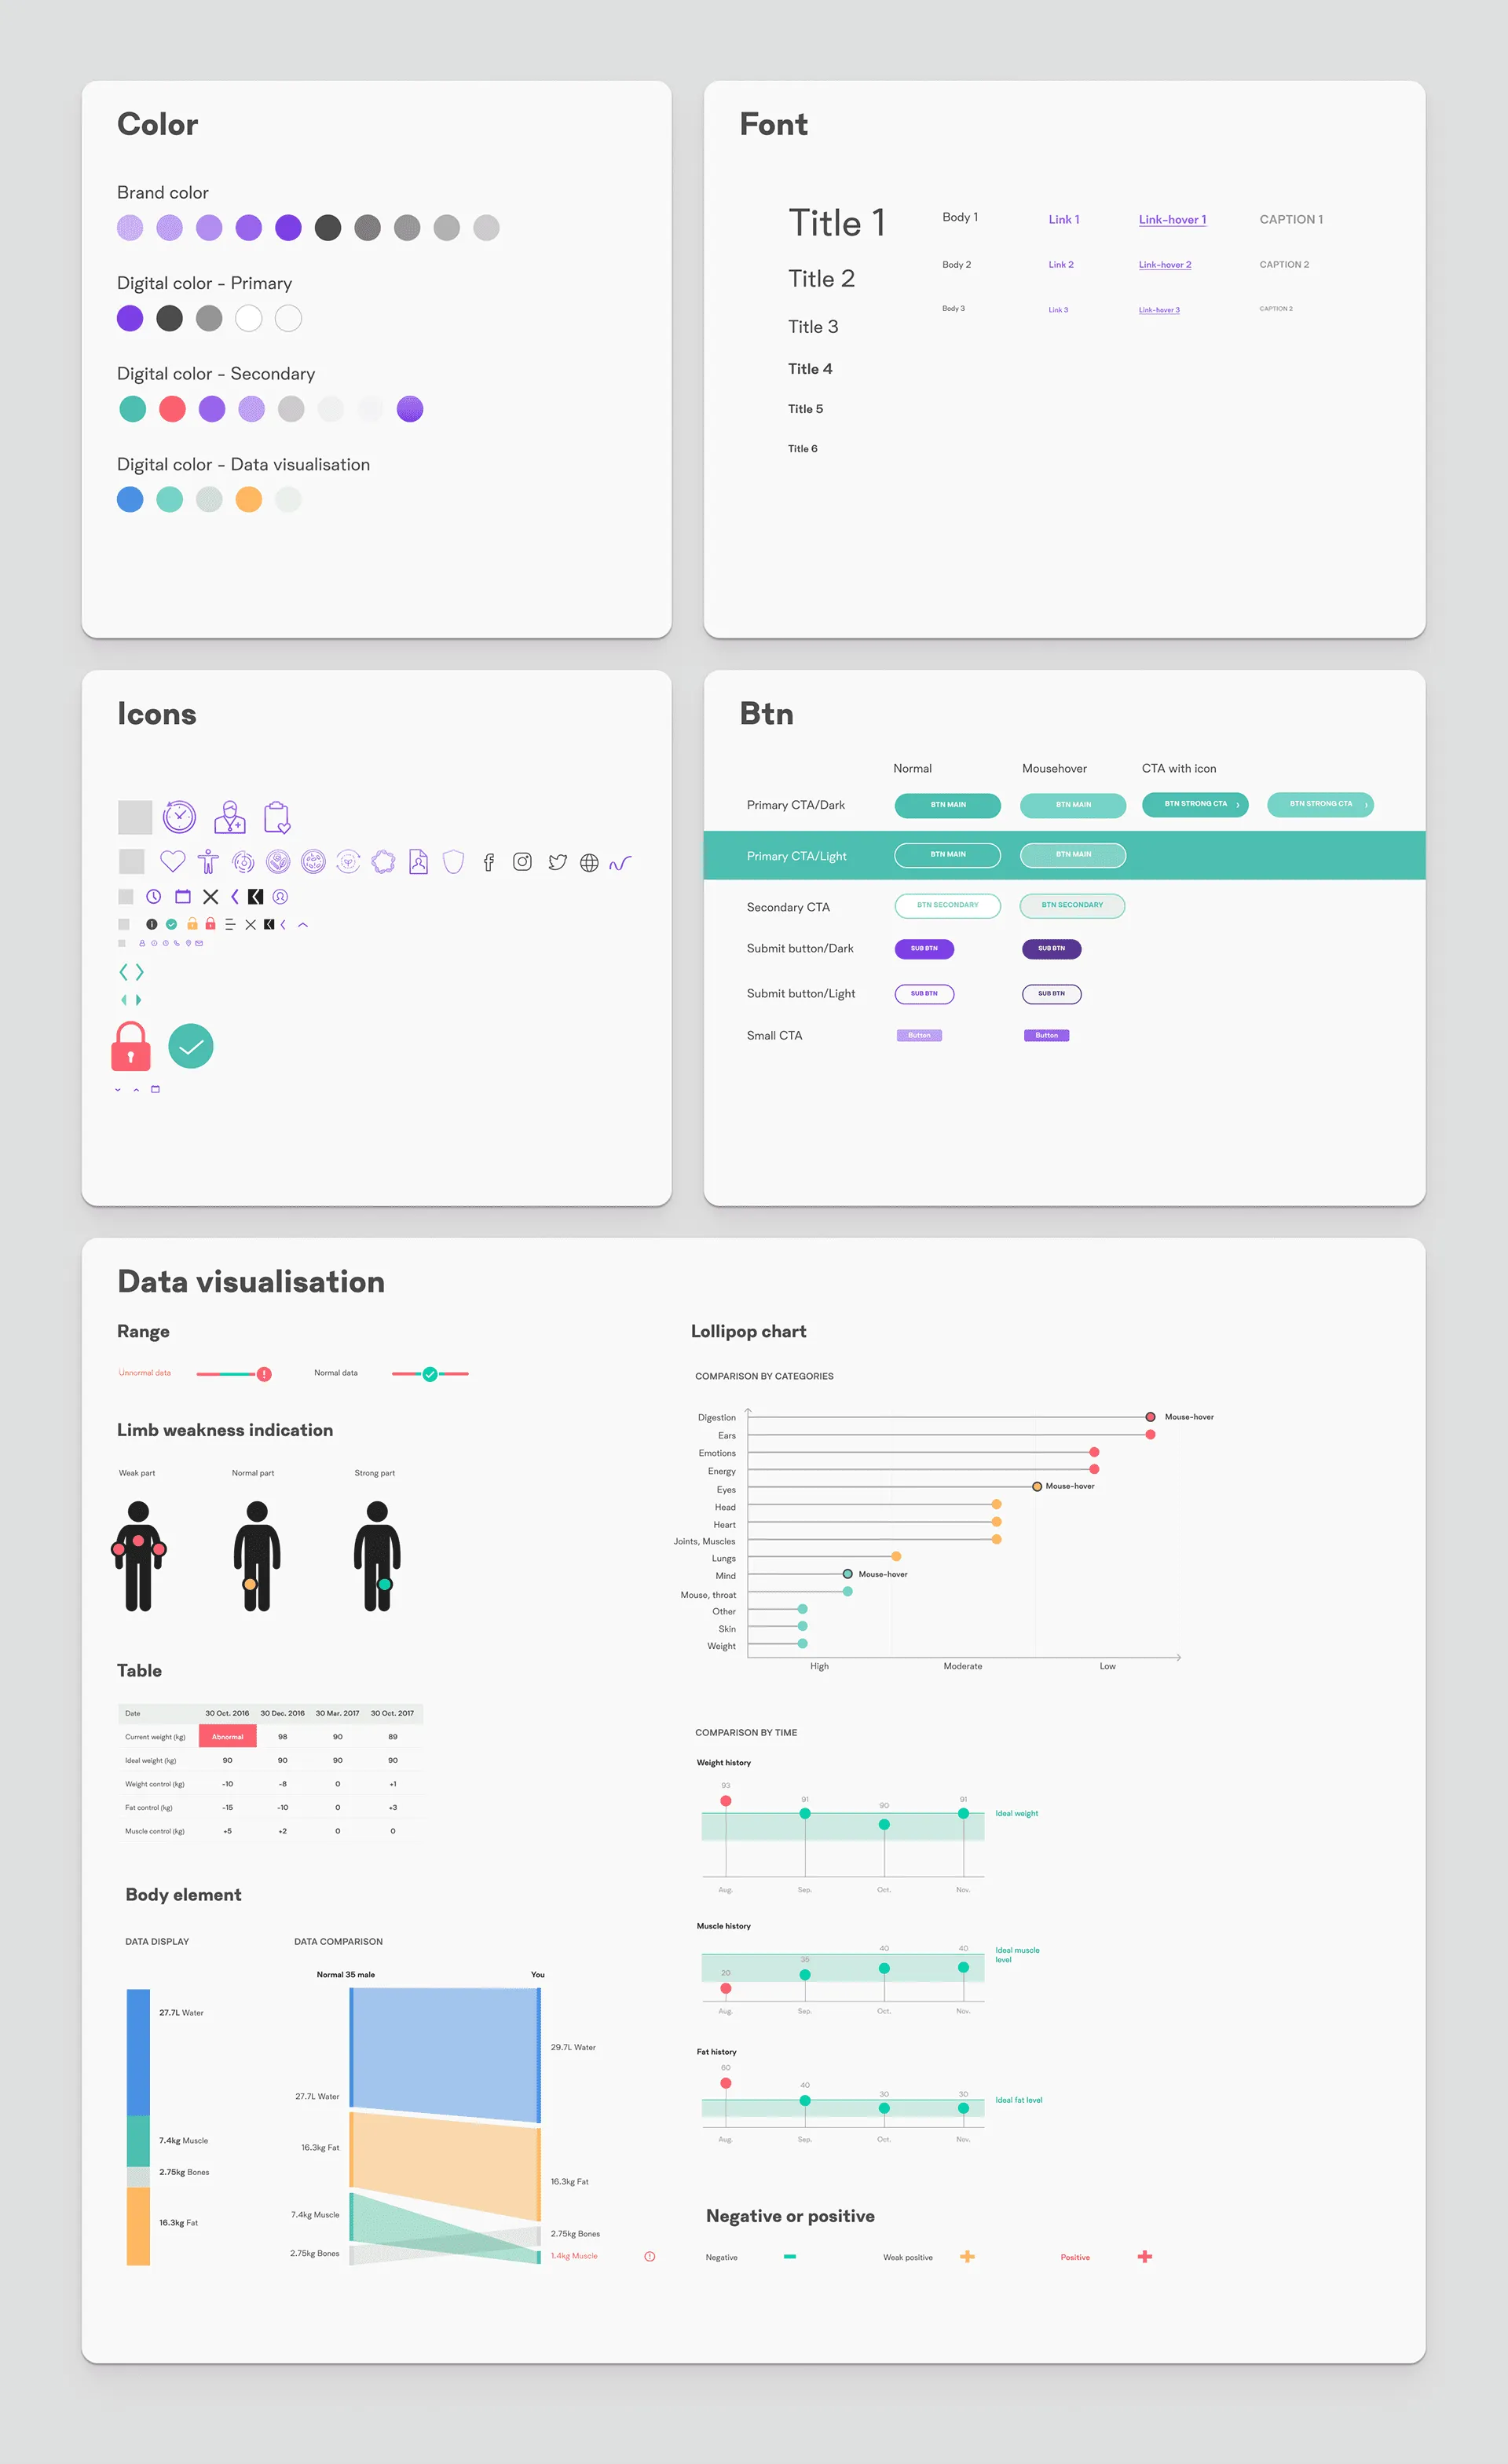
We also create a mini design system to help better collaborations between designers and developers.